
Embibe Experts Solutions for Chapter: Data Interpretation, Exercise 1: Bar Graph Representation Of Data
Embibe Experts Aptitude Solutions for Exercise - Embibe Experts Solutions for Chapter: Data Interpretation, Exercise 1: Bar Graph Representation Of Data
Attempt the practice questions on Chapter 1: Data Interpretation, Exercise 1: Bar Graph Representation Of Data with hints and solutions to strengthen your understanding. Practice book for English and Aptitude for VITEEE solutions are prepared by Experienced Embibe Experts.
Questions from Embibe Experts Solutions for Chapter: Data Interpretation, Exercise 1: Bar Graph Representation Of Data with Hints & Solutions
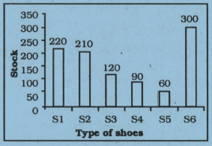
The following graph shows the total stock of different types of shoes. Answer the following question related to the graph.
S6 are what percent of total number of shoes?

The following graph represents the number of shoes available for different types of shoes. Study the following graph and answer the following question.
What is the average number of shoes in the stock?
The following graph represents No. of cars sold in different years from 2008 to 2016. Study the following graph and answer the following question.
The total sale in is what of sale in ?
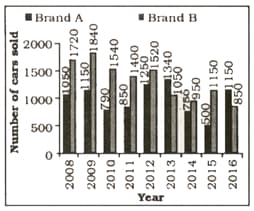
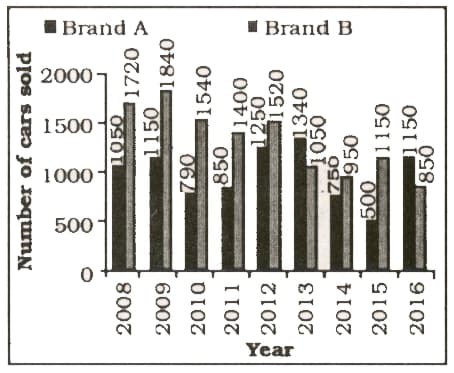
The following graph represents No. of cars sold by two brands A and B in different years from 2008 to 2016. Study the following graph and answer the following question.
In how many year number of car sold by brand A is more than brand B ?
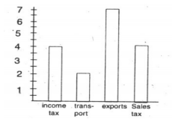
From the figure given below, if the income from transport is expected to be crores, the income from exports is expected to be?
The following graph represents number of candidates who cleared different exams. Study the given graph and answer the following question.
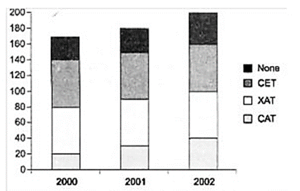
What is the percentage increase in the number of students in over ?
Following graph shows the ratio of expenditure to income of two companies A and B during the period of 2001 to 2007. Study the given graph and answer the following question.
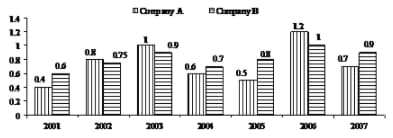
If the expenditure of Company A in 2004 is Rs 36 lakhs, then what is its income in that year?
Study the double bar graph given below and answer the question.
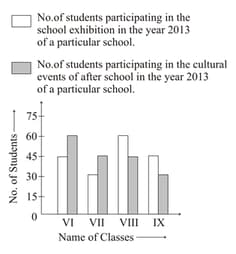
The average number of students participating in the exhibition is-


