Graphical Representation of Motion
Important Questions on Graphical Representation of Motion
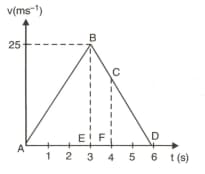
Study the velocity-time graph and calculate the distance covered in the region .

Study the velocity-time graph and calculate the average velocity from to .

Study the velocity-time graph and calculate the distance covered in the region .

Study the velocity-time graph and calculate the acceleration from to .

Study the velocity-time graph and calculate the acceleration from to .
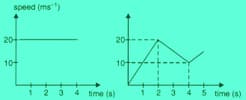
The graph given below shows how the speed of a car changes with time.

Find the distance traveled in the first eight hours.
The graph given below shows how the speed of a car changes with time.

Which part of the graph represents varying retardation?
The graph given below shows how the speed of a car changes with time.
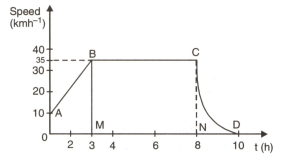
Which part of the graph shows zero acceleration?
The graph given below shows how the speed of a car changes with time.
What is the maximum speed attained by the car?
The graph given below shows how the speed of a car changes with time.

What is the initial speed of the car?
Draw a graph velocity versus time for a body that starts to move with a velocity '' under a constant acceleration '' for time ''. Using this graph derive an expression for distance covered '' in time ''.
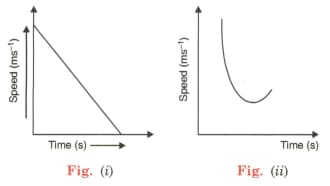
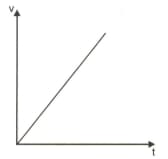
What can you conclude about the motion of a body depicted by a velocity time graph given below?
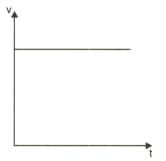
What would you conclude about the motion of a body depicted by the velocity time graph given below?
Four speed-time graphs are shown below.

Which graph represents the following case?
A body decelerating to constant speed and accelerating after a while.
Four speed-time graphs are shown below.
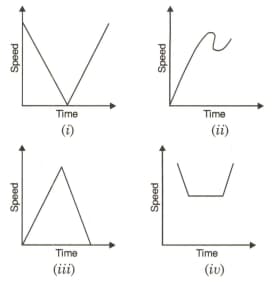
Which graph represents the following case?
A ball thrown vertically upward and returning to the hand of the owner.
The graph given below is a distance time graph of an object.

Does it represent a real situation? Justify your answer.
The graph given below is a distance time graph of an object.

How long was it stationary?
The graph given below is a distance time graph of an object.
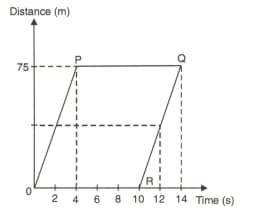
Find the speed of the object during the first of its journey.
Two graphs for motion of objects moving along a straight line are shown. State how the speed is changing with time in both the cases.
What do the graphs shown below indicate?