
Construction of Bar Graph
Important Questions on Construction of Bar Graph
Read the bar graph given below carefully and answer the following question by choosing the correct option.
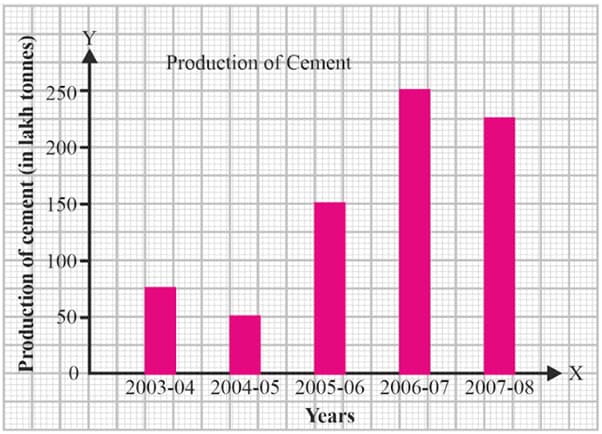
What was the production of cement in the year ?
From the following table which shows marks obtained by students in a maths class test, draw a bar graph.
| Marks | |||||||
| Number of students |
Read the bar graph shown and answer the following question:
On how many days was the circulation less than ?

Read the bar graph shown and answer the following question:
What the ratio of number of newspaper sold on Wednesday and on Sunday?

Read the bar graph shown and answer the following question:
On which day was the circulation minimum?
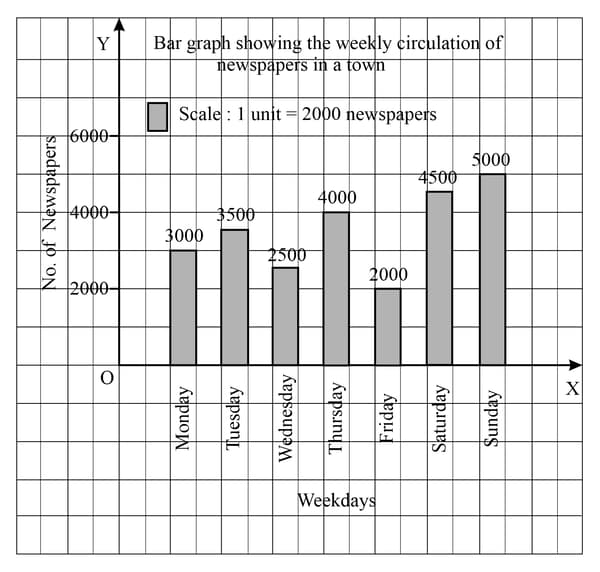
Read the bar graph shown and answer the following question:
On which day was the circulation maximum?

Read the bar graph shown and answer the following question:
What is the general information given by the bar graph?
Read the bar graph given and answer the following questions:
What is the information given by the bar graph?
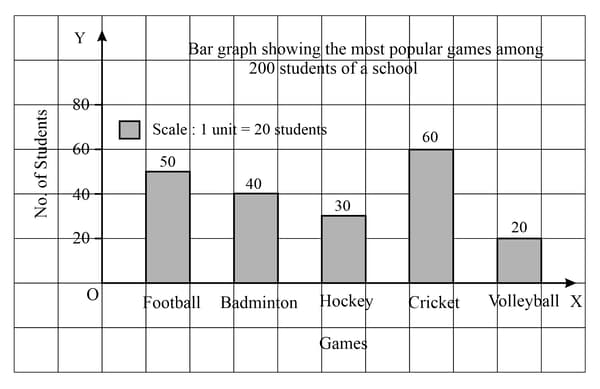
Read the bar graph given and answer the following questions:
Which game is played by the maximum number of students?

Read the bar graph given and answer the following questions:
Which game is played by the least number of students?

Read the bar graph given and answer the following questions:
What the ratio of number of students who play Cricket to that of Hockey?
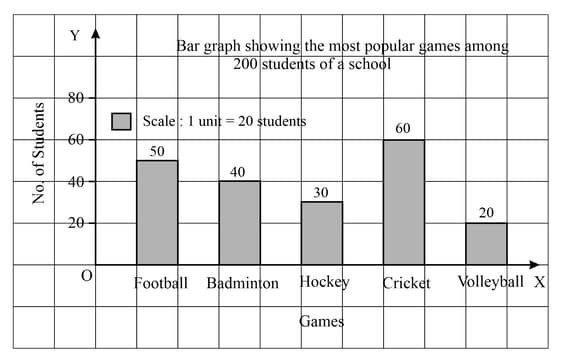
Read the bar graph given and answer the following questions:
How many students do like to play Volleyball?

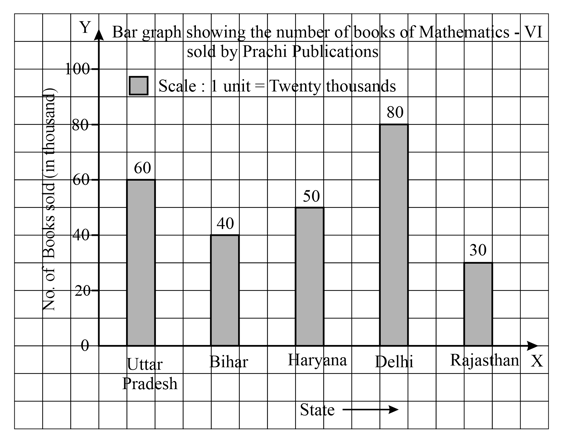
Read the bar graph given and answer the following questions:
What is the ratio of number of books sold in Uttar Pradesh to the maximum number of books sold in a state by the Prachi Publications?

Read the bar graph given and answer the following questions:
In which state was the minimum number of books sold?

Read the bar graph given and answer the following questions:
What is the information given by the bar graph?

Read the bar graph given and answer the following questions:
How many books of Class VI were sold by the Prachi Publications?
Read the bar graph given and answer the following questions:
How many subjects have been mentioned in the graph?

Read the bar graph given and answer the following questions:
Is the number of student liking Hindi is double than those liking Maths?

Read the bar graph given and answer the following questions:
Which subject is liked by least number of students?
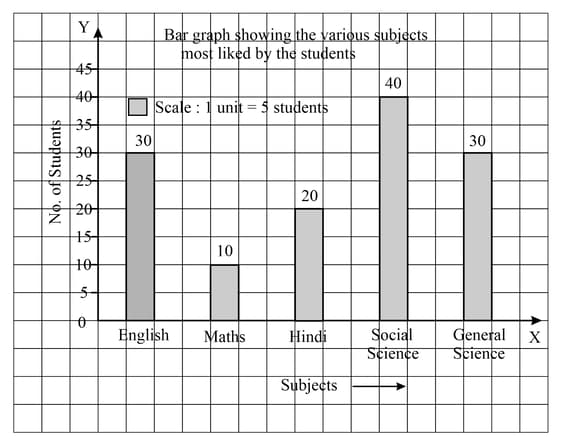
Read the bar graph given and answer the following questions:
What is the information given by the bar graph?


