
Pictograms/Pictographs
Important Questions on Pictograms/Pictographs
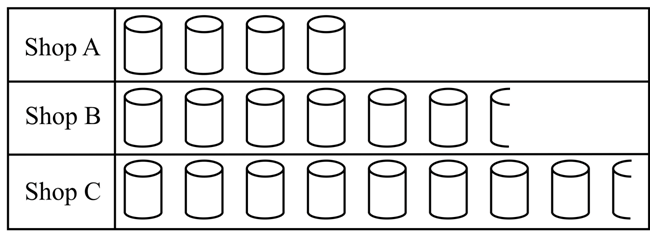
The pictograph shows the number of canned drinks sold by three different shops in a week.
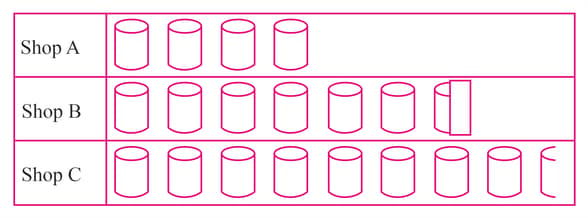
What is the total profit of shop , if the profit gained on each drink is
The following number of students came to class VI in the last week. Represent this information on a pictograph. Take the key as students.
| Day 1 | Day 2 | Day 3 | Day 4 | Day 5 | Day 6 |
The pictograph shows the number of canned drinks sold by three different shops in a week. What is the difference between the number of cans sold by shop and the number of cans sold by shop ?
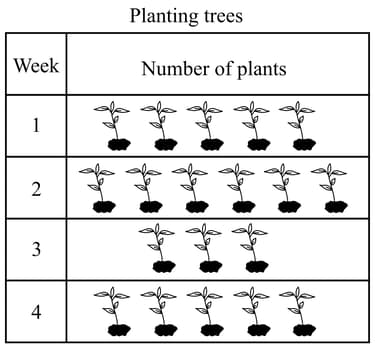
The children of a locality plant trees every week. The pictograph below shows the number of trees children plant each week for four weeks.
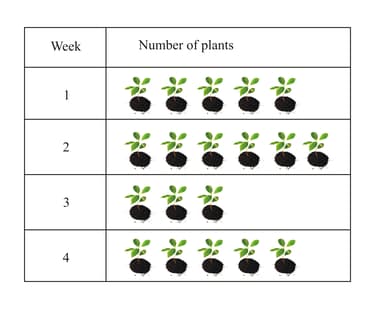
Key:  plant.
How many plants were planted between week and week ?
The children of a locality plant trees every week. The pictograph below shows the number of trees children plant each week for four weeks.

How many more trees need to be planted in week to be equal to those in week ?
A soft drink company organised a stall at a carnival where they sold the following quantities of various drinks.
| Drinks | Pista milk shakes | Badam milk shakes | Lemonades | Cola | Apple juice | Orange juice |
| Quantity | cartons | cartons | cartons | cartons | cartons | cartons |
Represent these in a bar graph, giving an appropriate key and a caption for the graph.
The children of a locality plant trees every week. The pictograph below shows the number of trees children plant each week for four weeks.
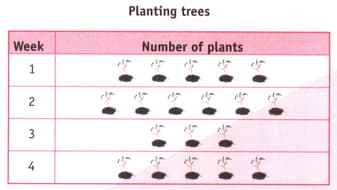
Key:  plant.
In which week did they plant more than trees?
Create a pictograph for the following data.
| Fruit | Oranges | Pineapples | Papayas | Apples | Pomegranates | Bananas |
| Stock |
The children of a locality plant trees every week. The pictograph below shows the number of trees children plant each week for four weeks.
Key:  plant.
How many trees were planted in week ?
Draw a pictogram to represent the data showing the different modes of transport used by the students of a school. Choose a suitable scale for the pictogram.
| Modes of transport | Number of students |
| Walking | |
| Bus | |
| Bicycle | |
| Car |
Draw a pictogram to show the population of a country during certain years. Choose a suitable scale for the pictogram.
| Year | Population of the country (in millions) |
Draw a pictogram to show the different age groups of people living in an apartment. Choose a suitable scale for the pictogram.
| Groups | Number |
| Parents | |
| Grandparents | |
| Children |
Draw a pictogram to show the number of students present in a class of during a week:
| Day | Students |
| Monday | |
| Tuesday | |
| Wednesday | |
| Thursday | |
| Friday |
Key:  students and
  students
Draw a pictogram to show the sale of rice in a grocery shop for a week:
| Day | Weight of rice sold (in ) |
| Monday | |
| Tuesday | |
| Wednesday | |
| Thursday | |
| Friday | |
| Saturday |
Key: 


