
Bar Graphs
Important Questions on Bar Graphs
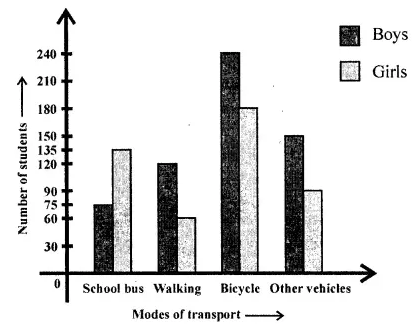
Given below a double bar graph.

Read the double bar graph carefully and answer the following question:
In which mode of transport the number of girls is half the number of boys?
Given below a double bar graph.
Read the double bar graph carefully and answer the following question:
Which mode of transport boys using the most?
Given below a double bar graph.

Read the double bar graph carefully and answer the following question:
Which mode of transport girls using more than the boys?
Given below a double bar graph.

Read the double bar graph carefully and answer the following question:
What is the information given by the double graph?
Given below a bar graph:
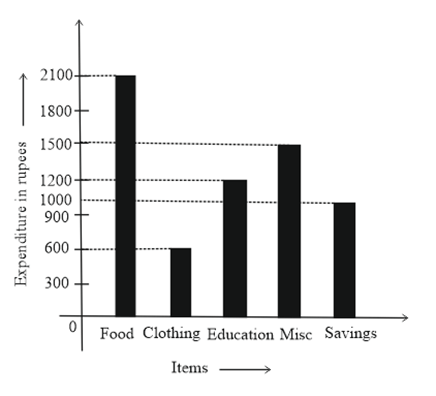
Read the bar graph carefully and answer the following question:
Expenditure on education is twice the expenditure on clothing.
Given below a bar graph:

Read the bar graph carefully and answer the following question:
On which item the expenditure is minimum?
Given below a bar graph:
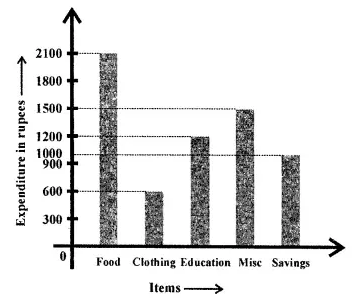
Read the bar graph carefully and answer the following question:
On which item the expenditure is maximum?
Given below a bar graph:

Read the bar graph carefully and answer the following question:
What is the information given by the bar graph?
The number of goals scored by a football team in different matches is given below:
Make a frequency distribution table using tally marks.
Mr Khurana has two kitchen appliance stores. He compares the sales of two straws during a month and recovered as given below:
|
Item |
Number of items sold |
|
|
Store |
Store |
|
|
Grill |
|
|
|
Toaster |
|
|
|
Oven |
|
|
|
Blender |
|
|
|
Coffee maker |
|
|
Represent the above data by a double bar graph.
The result of a survey of people about their favourite fruit is given below:
|
Fruit |
Apple |
Orange |
Banana |
Grapes |
Guava |
Pineapple |
Papaya |
|
Number of people |
|
|
|
|
|
|
|
Represent the above data by a bar graph.
Bar graphs are _____ representation of ungrouped data.


