
Bar Graphs
Important Questions on Bar Graphs
The line graph shows the number of storybooks Armaan read in the last 4 months of a year.
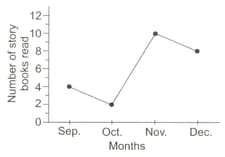
The number of storybooks that he read in October as a fraction of the total number of storybooks read is __ .
The given bar graph shows the production of Rice and Wheat in five states 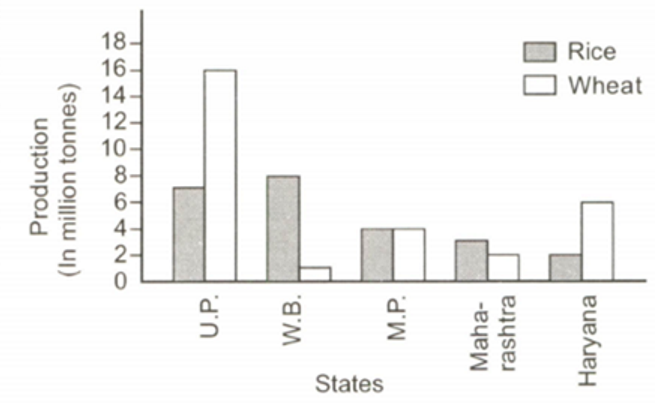
Which of the following states is the large producer of wheat?
DIRECTION(8-11):The given bar graph shows the marks obtained by a student in different subjects. The maximum marks of each subject is .
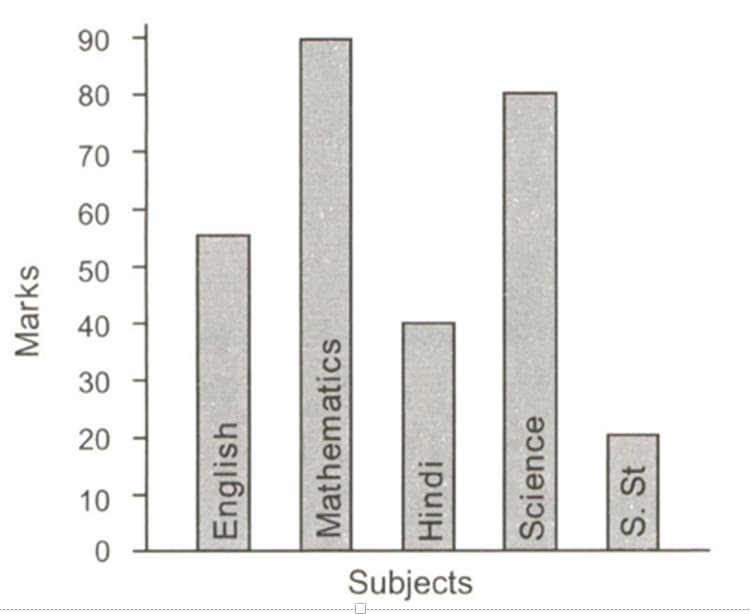
What is the ratio of the highest marks to the lowest marks obtained by the student?
The given bar graph shows the marks obtained by a student in different subjects. The maximum marks of each subject is .
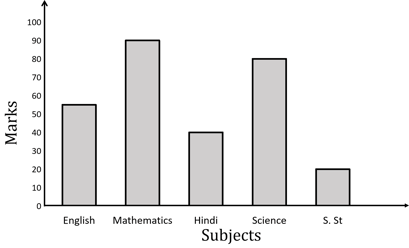
What is the percentage of marks obtained by the student?
The given bar graph shows the marks obtained by a student in different subjects. The maximum marks of each subject is .

What is the average marks obtained by the student?
The given bar graph shows the marks obtained by a student in different subjects.The maximum marks of each subject is

In which subject did the student score highest marks?


