
Jayashri Bhattacharya and Tarika Dhawan Solutions for Exercise 4: CHAPTER INNINGS
Jayashri Bhattacharya Mathematics Solutions for Exercise - Jayashri Bhattacharya and Tarika Dhawan Solutions for Exercise 4: CHAPTER INNINGS
Attempt the practice questions from Exercise 4: CHAPTER INNINGS with hints and solutions to strengthen your understanding. Universal Mathematics 6 solutions are prepared by Experienced Embibe Experts.
Questions from Jayashri Bhattacharya and Tarika Dhawan Solutions for Exercise 4: CHAPTER INNINGS with Hints & Solutions
A group of five friends have a hobby of collecting stamps. The pictograph in the figure shows the number of stamps each friend has. 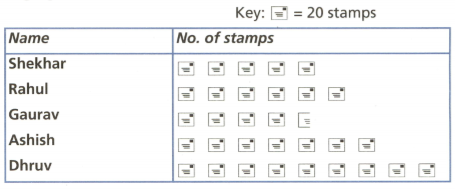
Use the pictograph to answer the question:
Find the number of stamps Gaurav has.
A group of five friends have a hobby of collecting stamps. The pictograph in the figure shows the number of stamps each friend has.
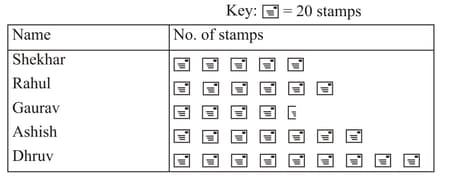
Use the pictograph to answer the question:
Who out of five friends has the maximum number of stamps? (Write the answer in single word.)
A group of five friends have a hobby of collecting stamps. The pictograph in the figure shows the number of stamps each friend has. 
Use the pictograph to answer the question:
Find the ratio of the number of stamps Rahul has to those Ashish has.
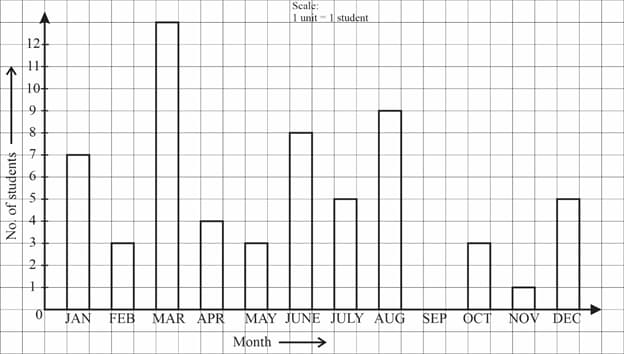
In which month do the maximum number of students have their birthday?
Read the bar graph shown in the figure and answer the question that follow:
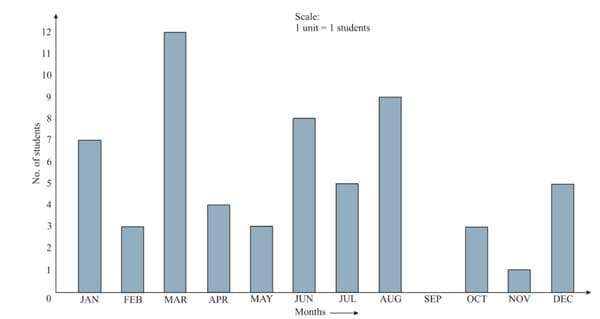
How many students are born in December?
Read the bar graph shown in the figure and answer the question that follow: 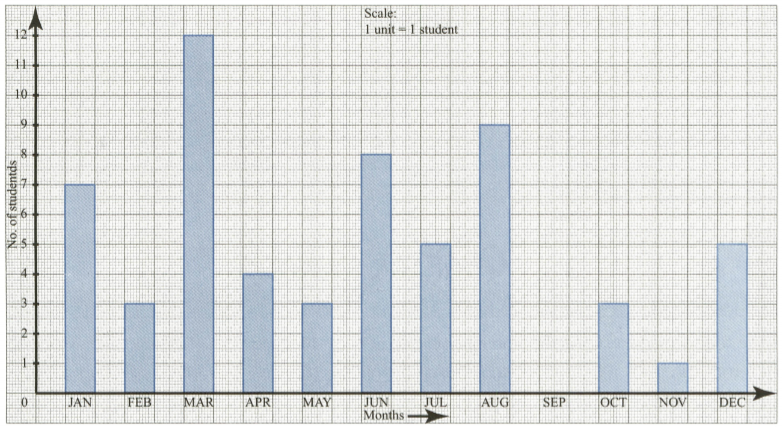
Find the number of students born in the first half of the year.
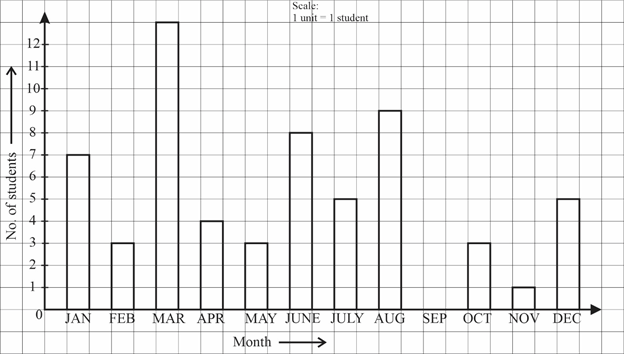
Find the ratio of the number of students born in January to those born in November.
The following table shows the yearly production of cycles by a company:
| Year | ||||
|---|---|---|---|---|
| No. of cycles produced |
Draw a bar graph for this data.


