
Jayashri Bhattacharya and Tarika Dhawan Solutions for Exercise 1: INNINGS
Jayashri Bhattacharya Mathematics Solutions for Exercise - Jayashri Bhattacharya and Tarika Dhawan Solutions for Exercise 1: INNINGS
Attempt the practice questions from Exercise 1: INNINGS with hints and solutions to strengthen your understanding. Universal Mathematics 6 solutions are prepared by Experienced Embibe Experts.
Questions from Jayashri Bhattacharya and Tarika Dhawan Solutions for Exercise 1: INNINGS with Hints & Solutions
The manager of a car showroom asked a salesperson to list the colour of the cars sold in a day. The salesperson collected the following data:
Silver, Black, White, Silver, Red, Black, Metallic Blue, White, Silver, Black, White, Black, Grey, Silver, White, Black, White, Black, Silver, Red, Black, Silver, Grey, Black, Red, Silver, Black, White, Silver, Grey
Make a frequency distribution table for this data
Twenty-Five cards were picked up from a pack of cards one by one. The cards picked up are as follows:
Spade, Club, Spade, Club, Spade, Spade, Club, Diamond, Heart, Club, Diamond, Club, Diamond, Club, Diamond, Spade, Diamond, Club, Spade, Diamond, Heart, Diamond, Heart, Club, Heart
Make a frequency distribution table for this data.
Rajesh is a footballer. In the last matches, he scored the following number of goals:
Make a frequency distribution table for this data.
The following pictograph shows the number of cakes sold by a confectionery shop in five days:
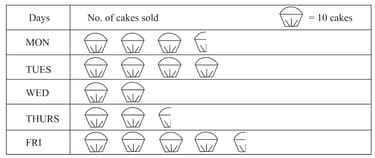
How many cakes were sold on Monday? (Write only number as answer)
The following pictograph shows the number of cakes sold by a confectionery shop in five days:
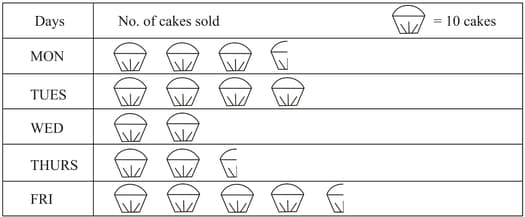
On which day were the fewest number of cakes sold ?
The following pictograph shows the number of cakes sold by a confectionary shop in five days:
How many more cakes were sold on Friday than on Wednesday?
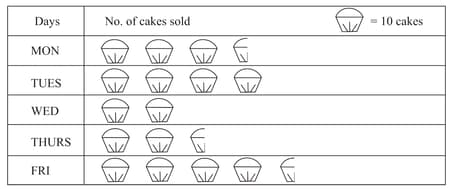
The following pictograph shows the number of cakes sold by a confectionery shop in five days:

On which day were the maximum number of cakes sold?
The number of tourists visiting Manali from May to September is shown below. Represent this information in the form of pictograph.
| Month | May | June | July | August | September |
| No. of | 16,000 | 16,500 | 10,000 | 7500 | 2500 |


