
Jharne De Solutions for Chapter: Data Handling, Exercise 1: Exercise
Jharne De Mathematics Solutions for Exercise - Jharne De Solutions for Chapter: Data Handling, Exercise 1: Exercise
Attempt the free practice questions on Chapter 17: Data Handling, Exercise 1: Exercise with hints and solutions to strengthen your understanding. MathSpark A course in mathematics Book 6 solutions are prepared by Experienced Embibe Experts.
Questions from Jharne De Solutions for Chapter: Data Handling, Exercise 1: Exercise with Hints & Solutions
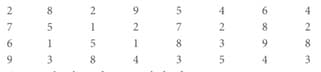
The heights (in cm ) of students of a class are as follows:
Arrange the data in a tabular form using tally marks.
Marks obtained by students out of marks in a maths test are:
Arrange the above data in a tabular form.
"Note: This question given in the book seems incomplete and the modified question should be as given below."
Marks obtained by students out of marks in a maths test are:
Arrange the above data in a tabular form.
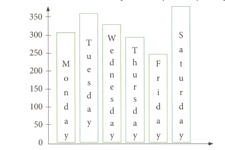
The following task shows the number of patients who visited an OPD of a city hospital during a particular week:
| Days | Monday | Tuesday | Wednesday | Thursday | Friday | Saturday |
| Number of Patients: | 300 | 240 | 180 | 150 | 250 | 270 |
Draw a bar graph to represent the above data and answer the following question:
How many patients visited on Tuesday?
The birth rate per thousand in five countries over a period of time is given below:
| Country: | China | India | Sweden | England | Germany |
| Birth Rate: |
Draw a bar graph to represent the above data.
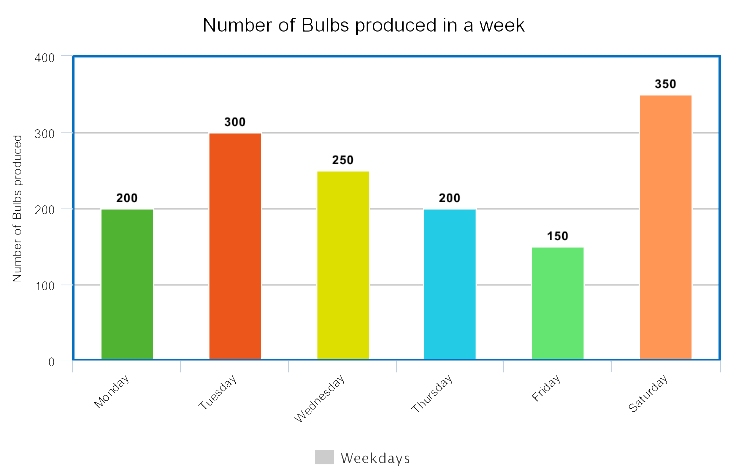
The bar graph below shows the number of bulbs produced by a factory during certain week.

Answer the following question:
On which day were the minimum number of bulbs produced?
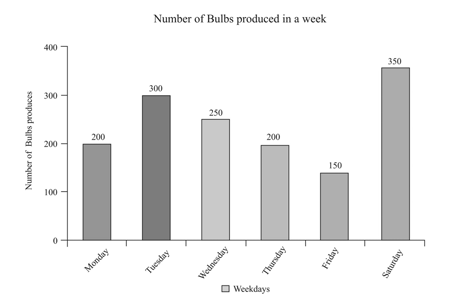
The bar graph below shows the number of bulbs produced by a factory during certain week.

Answer the following question:
On which days were an equal number of bulbs produced?
The bar graph below shows the number of bulbs produced by a factory during certain week.
“Note: This question given in the book seems to have error and the modified question should be as given below.” (insufficient data)
The bar graph below shows the number of bulbs produced by a factory during certain week.
Answer the following question:
What is the total number of bulbs produced during the week?
The bar graph below shows the number of bulbs produced by a factory during certain week.
Answer the following question:
On which day were the maximum number of bulbs produced?


