
Jharne De and Ranjana Kumar Solutions for Chapter: Data Handling, Exercise 3: Revision Exercise
Jharne De Mathematics Solutions for Exercise - Jharne De and Ranjana Kumar Solutions for Chapter: Data Handling, Exercise 3: Revision Exercise
Attempt the practice questions on Chapter 17: Data Handling, Exercise 3: Revision Exercise with hints and solutions to strengthen your understanding. Math Sight solutions are prepared by Experienced Embibe Experts.
Questions from Jharne De and Ranjana Kumar Solutions for Chapter: Data Handling, Exercise 3: Revision Exercise with Hints & Solutions
Study the graph given below and answer the following questions.

How many more students ate pear than orange?
Study the graph given below and answer the following questions.

Write the total number of students who told their choice of fruit.
Study the graph given below and answer the following questions.
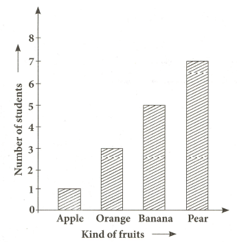
What will be one-fourth of the total number of students who told their choice?
Read the given pictograph and answer the following questions?
Scale used trees
trees
| Years | No. of trees planted |
|
|
|
|
|
|
|
|
|
|
|


In which year were the maximum number of trees planted?
Read the given pictograph and answer the following questions?
Scale used trees
trees
| Years | No. of trees planted |
|
|
|
|
|
|
|
|
|
|
|


What is the difference between the number of trees planted in and ?
Read the given pictograph and answer the following questions?
Scale used trees
trees
| Years | No. of trees planted |
|
|
|
|
|
|
|
|
|
|
|


How many more trees were planted in than in ?
Read the given pictograph and answer the following questions?
Scale used trees
trees
| Years | No. of trees planted |
|
|
|
|
|
|
|
|
|
|
|


In which year were the least number of trees planted?
Read the given pictograph and answer the following questions?
Scale used trees
trees
| Years | No. of trees planted |
|
|
|
|
|
|
|
|
|
|
|


How many trees were planted in all the four years?


