Karen Morrison and Nick Hamshaw Solutions for Exercise 2: Exercise 18.2
Karen Morrison Mathematics Solutions for Exercise - Karen Morrison and Nick Hamshaw Solutions for Exercise 2: Exercise 18.2
Attempt the practice questions from Exercise 2: Exercise 18.2 with hints and solutions to strengthen your understanding. Cambridge IGCSE® Mathematics Core and Extended Coursebook Second Edition solutions are prepared by Experienced Embibe Experts.
Questions from Karen Morrison and Nick Hamshaw Solutions for Exercise 2: Exercise 18.2 with Hints & Solutions
Construct a table of values of from and plot the graph.
Using values of from to , construct a table of values and plot the graph of
Using values of from to , construct a table of values and plot the graph of
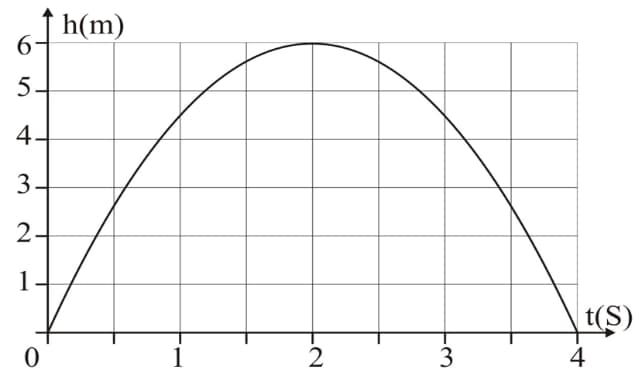
People who design water displays (often set to music) need to know how high water will rise from a jet and how long it will take to return to the pool. This graph shows the height of a water arc from a fountain (in metres) over a number of seconds. What was the greatest height (in metres) reached by the water arc.
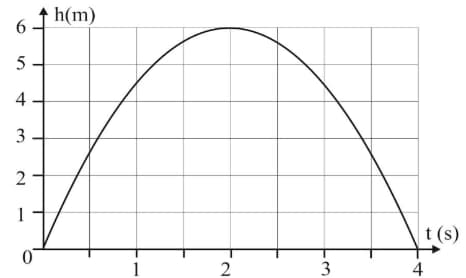
People who design water displays (often set to music) need to know how high water will rise from a jet and how long it will take to return to the pool. This graph shows the height of a water arc from a fountain (in metres) over a number of seconds. How long (in seconds) did it take the water to reach the greatest height?
 .
.
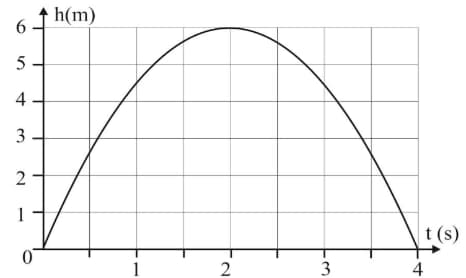
People who design water displays (often set to music) need to know how high water will rise from a jet and how long it will take to return to the pool. This graph shows the height of a water arc from a fountain (in metres) over a number of seconds. For how long was the water arc above a height of .
 ..
..
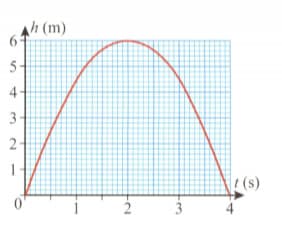
People who design water displays (often set to music) need to know how high water will rise from a jet and how long it will take to return to the pool. This graph shows the height of a water arc from a fountain (in metres) over a number of seconds. How far (in meters) did the water rise in the first second?
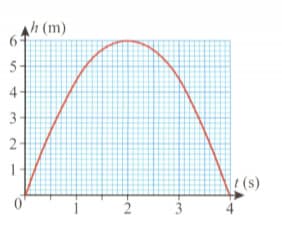
People who design water displays (often set to music) need to know how high water will rise from a jet and how long it will take to return to the pool. This graph shows the height of a water arc from a fountain (in metres) over a number of seconds. Why do you think this graph shows only positive values of height.
