Kerala Board Solutions for Chapter: Pie Charts, Exercise 1: Exercise 1
Kerala Board Mathematics Solutions for Exercise - Kerala Board Solutions for Chapter: Pie Charts, Exercise 1: Exercise 1
Attempt the free practice questions on Chapter 14: Pie Charts, Exercise 1: Exercise 1 with hints and solutions to strengthen your understanding. Mathematics for Class 7 - Part 2 solutions are prepared by Experienced Embibe Experts.
Questions from Kerala Board Solutions for Chapter: Pie Charts, Exercise 1: Exercise 1 with Hints & Solutions
Look at this picture showing various expenses at Fatima's home.
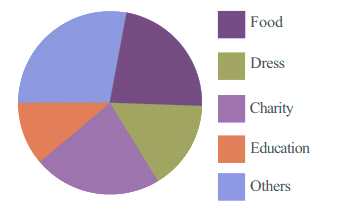
How do we know that, same amount is spent?
The pie chart below shows the various occupations of people in a panchayath.
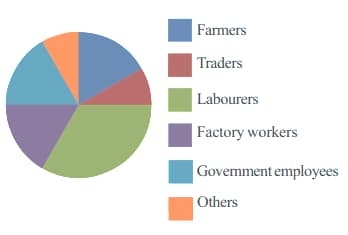
Arrange the occupations in the order of the number of people in each.
Arrange in descending order.
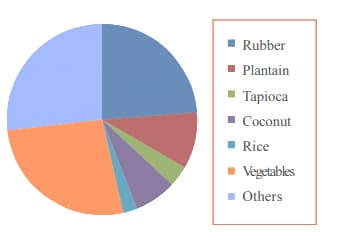
The pie chart below shows how the total farmland in a Panchayat is used for various crops.

Based on this figure, answer the following questions:
For which is the least land used?
The pie chart below shows how the total farmland in a Panchayat is used for various crops.
Based on this figure, answer the following questions:
For which is the most land used?
The pie chart below shows how the total farmland in a Panchayat is used for various crops.

Based on this figure, answer the following questions:
Roughly, what fraction of the total land is used for vegetables?
Given below is the pie-chart showing how Aravind, a class student spends his time:
The circle is divided into parts, each part indicating one hour.
What each colour shows is given below.
 School
 Sleep
Sleep
 Studies
 Play/exercise
 Others
Draw a bar graph showing these details.
There are books in the school library, classified as shown below.
Short story
Poetry
Novel
Science
Biography
Draw a pie chart showing this.
In a survey, the number of students who like different kinds of books were found as follows.
Short story
Poetry
Novel
Science
Biography
Draw a pie chart of this also.
Compare the two pie-charts.
Are books bought according to the preference of the students?
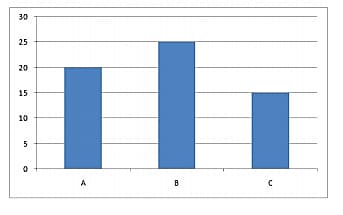
The bar graph below shows the number of girls in the three divisions of class in a school.
Draw a pie chart of this.