
Kusum Wadhwa and Anju Loomba Solutions for Chapter: Data Handling, Exercise 2: Values and attitudes
Kusum Wadhwa Mathematics Solutions for Exercise - Kusum Wadhwa and Anju Loomba Solutions for Chapter: Data Handling, Exercise 2: Values and attitudes
Attempt the free practice questions on Chapter 13: Data Handling, Exercise 2: Values and attitudes with hints and solutions to strengthen your understanding. Destination Maths 5 solutions are prepared by Experienced Embibe Experts.
Questions from Kusum Wadhwa and Anju Loomba Solutions for Chapter: Data Handling, Exercise 2: Values and attitudes with Hints & Solutions
The students of class V of Modem RVS school decide to record the mode of transport they use to come to school. They make the bar graph as follows.

The number of modes of transport for coming to school shown in the above figure is _____.
The students of class V of Modem RVS school decide to record the mode of transport they use to come to school. They make the bar graph as follows.
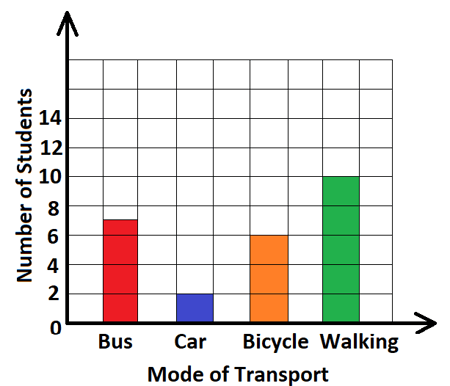
Maximum number of students go to school by _____.
The students of class of Modem RVS school decide to record the mode of transport they used to come to school. They make the bar graph as follows.

The number of students is shown on the _____ axis.
The students of class V of Modem RVS school decide to record the mode of transport they used to come to school. They make the bar graph as follows.
Read the graph and answer the question.

The title of the graph can be _____.(mode of transportation to school / mode of transportation to playground)
The students of class V of Modem RVS school decide to record the mode of transport they used to come to school. They make the bar graph as follows.
Read the graph and answer the question.

The total number of students in class V is _____.
The students of class V of Modem RVS school decide to record the mode of transport they use to come to school. They make the bar graph as follows.
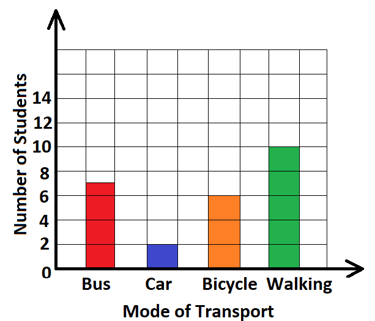
The environmental-friendly mode of coming to school are bicycle and _____.
The students of class V of Modem RVS school decide to record the mode of transport they use to come to school. They make the bar graph as follows.
Read the graph and answer the question.

What is better-traveling by personal car or a carpool? Why? _______.


