Lynn Byrd, Greg Byrd and, Chris Pearce Solutions for Chapter: Interpreting Results, Exercise 5: Exercise 16.4
Lynn Byrd Mathematics Solutions for Exercise - Lynn Byrd, Greg Byrd and, Chris Pearce Solutions for Chapter: Interpreting Results, Exercise 5: Exercise 16.4
Attempt the practice questions on Chapter 16: Interpreting Results, Exercise 5: Exercise 16.4 with hints and solutions to strengthen your understanding. Cambridge Lower Secondary Mathematics Learner's Book 7 Second Edition Digital Access solutions are prepared by Experienced Embibe Experts.
Questions from Lynn Byrd, Greg Byrd and, Chris Pearce Solutions for Chapter: Interpreting Results, Exercise 5: Exercise 16.4 with Hints & Solutions
The infographic shows the mass of bananas produced by different countries.
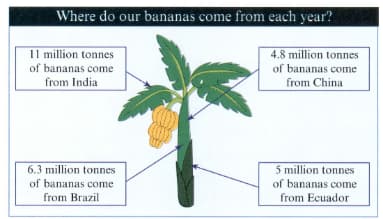
What mass of bananas does China produce?
The infographic shows the mass of bananas produced by different countries.
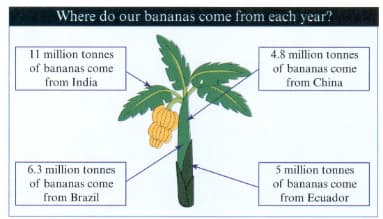
India produces _____ million tonnes more bananas than Brazil.
Viktor see this infographic at a train station. It shows the percentage of trains that arrive early, on time or late or are cancelled.
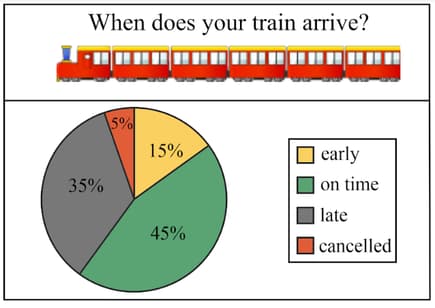
What percentage of trains arrive early?
Viktor see this infographic at a train station. It shows the percentage of trains that arrive early, on time or late or are cancelled.
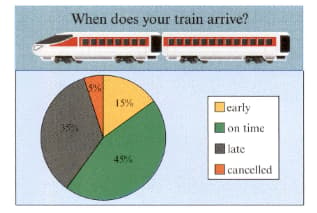
What percentage of trains are cancelled?
Viktor see this infographic at a train station. It shows the percentage of trains that arrive early, on time or late or are cancelled.
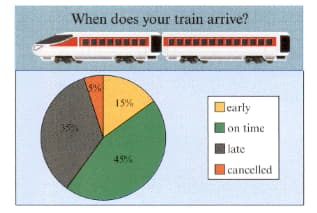
The train station manager say, 'Over half of our trains arrive on time.'.
Is the manager correct? Explain your answer.
This infographic shows the number of people killed by animals in one year.
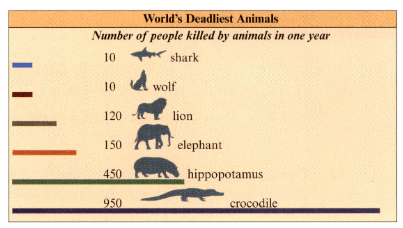
How many people were killed by a lion?
This infographic shows the number of people killed by animals in one year.
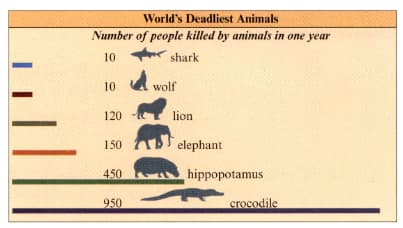
How many more people were killed by an elephant than by a wolf?
This infographic shows the number of people killed by animals in one year.
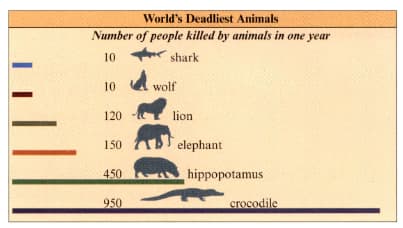
Which animal killed the most number of people?
