
Maharashtra Board Solutions for Exercise 3: Practice Set 11.2
Maharashtra Board Mathematics Solutions for Exercise - Maharashtra Board Solutions for Exercise 3: Practice Set 11.2
Attempt the practice questions from Exercise 3: Practice Set 11.2 with hints and solutions to strengthen your understanding. Mathematics Standard Eight solutions are prepared by Experienced Embibe Experts.
Questions from Maharashtra Board Solutions for Exercise 3: Practice Set 11.2 with Hints & Solutions
Observe the following graph and answer the question :-
State the type of the graph. (Subdivided bar graph / bar graph)
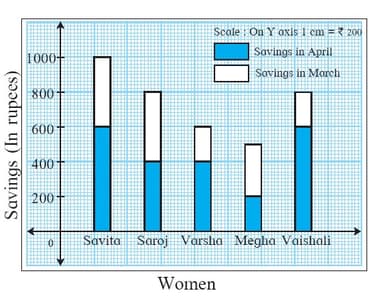
Observe the following graph and answer the question:
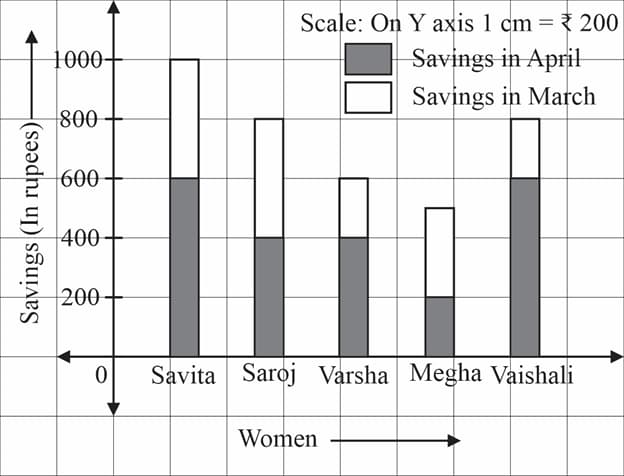
How much is the savings of Vaishali in the month of April? (Without using symbol)

If the total savings of Saroj in the months of March and April is , then find .
Observe the following graph and answer the question:
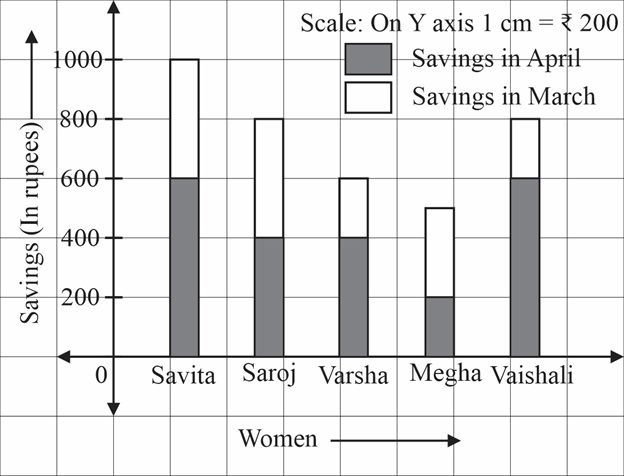
If the total savings of Savita is more than the total savings of Megha, then find the value of .
Observe the following graph and answer the question.
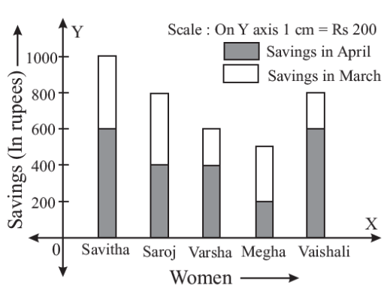
Whose savings in the month of April is the least?
The number of boys and girls, in std to std in a Z.P. school is given in the table. Draw a subdivided bar graph to show the data. (Scale: On Y axis, students)
| Standard | ||||
| Boys | ||||
| Girls |
In the following table number of trees planted in the year and in four towns is given. Show the data with the help of subdivided bar graph.
| Karjat | Wadgoam | Shivapur | Khandala | |
In the following table, data of the transport means used by students in standard for commutation between home and school is given. Draw a subdivided bar diagram to show the data.
(Scale: On Y axis: students)
| Paithan | Yeola | Shahapur | |
| Cycle | |||
| Bus and Auto | |||
| On foot |


