Mary Jones and Geoff Jones Solutions for Chapter: Reproduction in Humans, Exercise 4: End-of-chapter questions
Mary Jones Biology Solutions for Exercise - Mary Jones and Geoff Jones Solutions for Chapter: Reproduction in Humans, Exercise 4: End-of-chapter questions
Attempt the practice questions on Chapter 17: Reproduction in Humans, Exercise 4: End-of-chapter questions with hints and solutions to strengthen your understanding. Cambridge IGCSE® Biology Coursebook Third Edition solutions are prepared by Experienced Embibe Experts.
Questions from Mary Jones and Geoff Jones Solutions for Chapter: Reproduction in Humans, Exercise 4: End-of-chapter questions with Hints & Solutions
After the baby is born, it's main source of food is milk. Give two advantages of feeding a baby on breast milk rather than using milk prepared from milk powder.
The diagram shows a human sperm.

mitochondrion
The diagram shows a human sperm. With reference to the diagram, explain how the structure of a sperm adapts it for its function.

The diagram shows a human sperm. Describe how a human egg cell is adapted for its function.
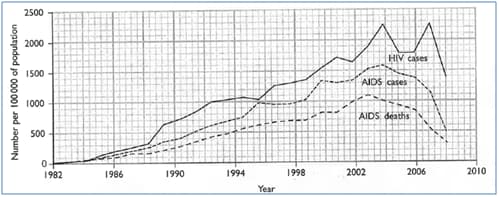
The graph shows the number of people in the Caribbean who were known to be infected with HIV, who had AIDS and who died from AIDS, between and . With reference to the graph, describe the changes in the number of people infected with HIV between 1982 and 2008.With reference to the graph, describe the changes in the number of people infected with HIV between and .
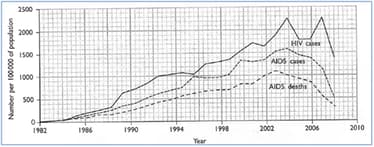
The graph shows the number of people in the Caribbean who were known to be infected with HIV, who had AIDS and who died from AIDS, between and . Suggest why the actual number of people infected with HIV may be greater than the numbers shown on the graph.

The graph shows the number of people in the Caribbean who were known to be infected with HIV, who had AIDS and who died from AIDS, between and . Explain how infection with HIV leads to the symptoms of AIDS.

The graph shows the number of people in the Caribbean who were known to be infected with HIV, who had AIDS and who died from AIDS, between and . Suggest the reasons for the shape of the graphs between and .