
Pie Chart
Important Questions on Pie Chart
According to a survey among certain group of young people regarding the type of music they like, a pie-chart was made as following. Study the pie chart and answer the following questions:
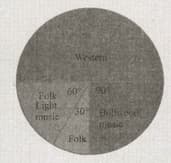
(b) A music company is planning to make CDs. Which type of music shall it choose to get the most customers?
According to a survey among certain group of young people regarding the type of music they like, a pie-chart was made as following. Study the pie chart and answer the following questions:
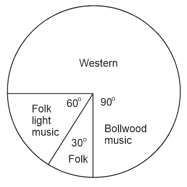
(a) If people like the bollywood music, then how many people are surveyed?
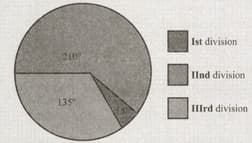
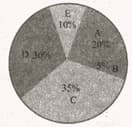
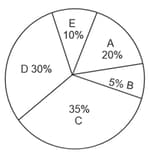
The following pie chart represents the result analysis of a competitive exam in which the number of candidates scoring division is Study the pie chart and answer the following questions:
(a) What is the total number of candidates?
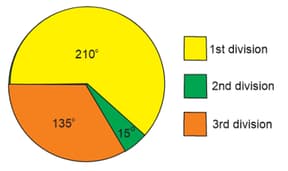
The following pie chart represents the result analysis of a competitive exam in which the number of candidates scoring division is Study the pie chart and answer the following questions:
(b) What is candidates who scored division?
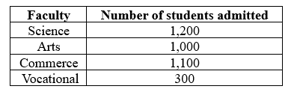
Draw a pie chart to represent the following information:
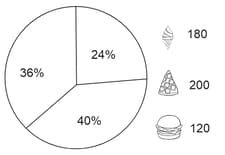
Place each symbol in the correct sector of the following pie chart.
The monthly salary of a person is . The central angle of the sector representing his expenses on food and house rent on a pie chart is What is the amount that he spends on food and house rent?
Data collected in a survey shows that of the buyers are interested in buying a particular brand of mouth wash. What is the central angle of the sector of the pie chart that represents this information?
Name the type of graph in which the central angle is involved.
Study the following pie chart. If it represents the number of votes received by candidates and the total number of votes is , then find the votes got by the winning and losing candidates.
A survey was conducted to find the beverages preferred by a group of students:
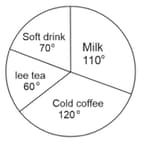
(b) If students like to drink cold coffee, then how many students were surveyed?
A survey was conducted to find the beverages preferred by a group of students:
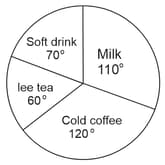
(a) Which beverage is liked the most by the students?
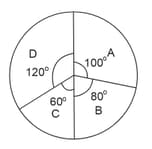
Observe the pie chart and answer the following questions:
(a) Which candidate received one-third of the number of votes received by other candidate?
Observe the pie chart and answer the following questions:
(a) Which candidate received one-fifth of the votes?
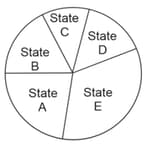
The following pie chart depicts the number of scientific institutions in different states. Which state has the least number of such institutions?
Following data gives breakup of the cost of production of a book:
| Paper | Printing | Binding | Publicity | Royalty | Others |
Draw a pie-chart depicting this information.
Construct a pie chart to depict the data given below:
| Various fields | Agriculture | Power | Transport | Small industries | Employment | Others |
| Allocated expenditure(in lakh) |
Listed below are the temperatures of a city in for days.
What is the range of given data?
What term is used for the graphical representation showing the relationship between a whole and its part?
In a _____, sectors represent the given data in a circle.


