Graphical Representation of Data
Important Questions on Graphical Representation of Data
Shall we draw a frequency polygon for frequency distribution of discrete series?
Is it necessary to draw a histogram for drawing a frequency polygon?
The area of histogram of a data and its frequency polygon is the same. Reason how.
How do we complete the polygon when there is no class preceding the first class?
What does the sum of heights of all rectangles represent?
Which value decides the width of each rectangle in the histogram?
Class boundaries are taken on the ‘X’-axis. Why not class limits?
Observe the following histogram and answer the question.

How many students are surveyed in total?
Observe the following histogram and answer the question.
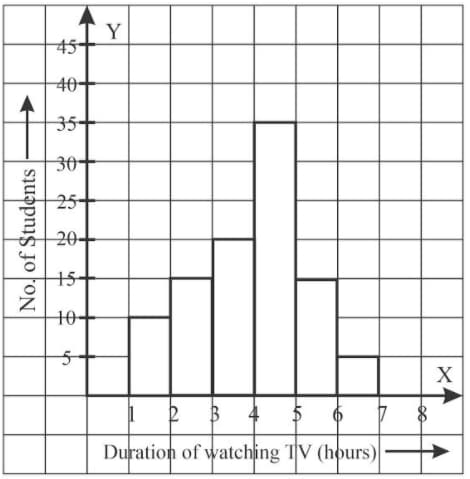
How many students watch TV for hours or more?
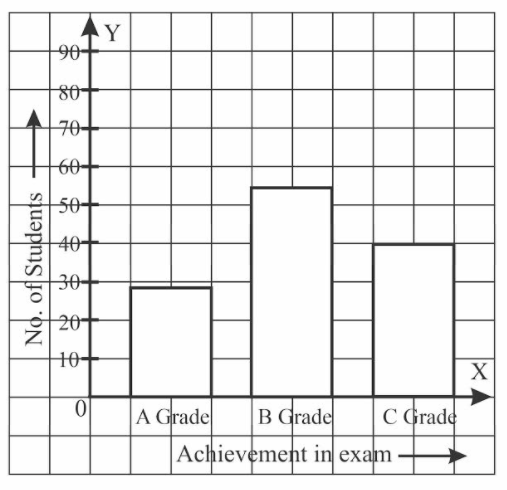
Observe the following histogram and answer the following question.

Which group contains a maximum number of students?
Observe the following histogram and answer the following question.

What information is being represented in the histogram?
Observe the following histogram for the given grouped frequency distribution.
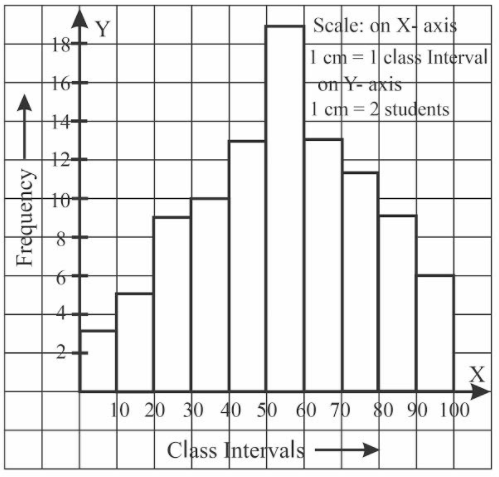
| Class Interval (Marks) | Frequency (No. of Students) |
Shall we interchange any two bars of the graph?
Observe the following histogram for the given grouped frequency distribution.

| Class Interval (Marks) | Frequency (No. of Students) |
Width of all bars is same. What may be the reason?
Observe the following histogram for the given grouped frequency distribution.

| Class Interval (Marks) | Frequency (No. of Students) |
In what proportion the height of the bars are drawn?
Observe the following histogram for the given grouped frequency distribution.

| Class Interval (Marks) | Frequency (No. of Students) |
How many bars are there in the graph.
Where do we use vertical bar graphs and horizontal bar graphs.
Does the variation in the value of a bar affect the values of other bars in the same graph?
Does the length of each bar depend on the lengths of other bars in the graph?
All the bars (or rectangles) in a bar graph have
How many students are there in the class?