
NA
Amit Rastogi Mathematics Solutions for Exercise - NA
Simple step-by-step solutions to NA questions of Data Handling from ThinkTrail NUMBER CHRONICLES Welcome to the World of Maths Thrills Grade 8. Also get 3D topic explainers, cheat sheets, and unlimited doubts solving on EMBIBE.
Questions from NA with Hints & Solutions
Draw a bar graph to represent the following information.
| Items | Rent | Food | Education | Clothing | Miscellaneous |
| Monthly expenditure of a family(in percentage) |
Draw a bar graph to represent the following information.
| Years | |||||
| Number of computers sold by a dealer (in thousand) |
From the following data which shows the population of a country in various years, draw a bar graph.
| Years | |||||||
| Population in millions |
Honey recorded the types of vehicles passing on a road in hour and presented her findings in a bar graph. Study the bar graph and answer the given questions:

How many vehicles in all passed on the road in hour?
Honey recorded the types of vehicles passing on a road in hour and presented her findings in a bar graph. Study the bar graph and answer the given questions:

Name the vehicle which passed the minimum number of times.
The following table gives the number of students in class in a school during academic years to . Represent the data by a bar graph.
| Academic year | - | - | - | - | - |
| Number of students |
Honey recorded the types of vehicles passing on a road in hour and presented her findings in a bar graph. Study the bar graph and answer the given questions:
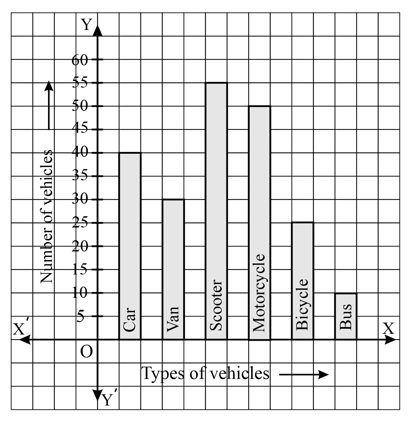
Name the vehicle which passed the miximum number of times.
The monthly income of a family is The monthly expenditure is represented by the adjoining pie-chart. Read the pir-chart and answer the following question.
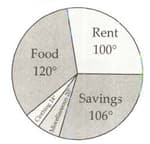
How much does the family save per month?


