Monica Capoor Solutions for Chapter: Data Handling II Bar Graphs and Histograms, Exercise 2: EXERCISE
Monica Capoor Mathematics Solutions for Exercise - Monica Capoor Solutions for Chapter: Data Handling II Bar Graphs and Histograms, Exercise 2: EXERCISE
Attempt the practice questions on Chapter 8: Data Handling II Bar Graphs and Histograms, Exercise 2: EXERCISE with hints and solutions to strengthen your understanding. Number Magic a textbook of Mathematics 8 solutions are prepared by Experienced Embibe Experts.
Questions from Monica Capoor Solutions for Chapter: Data Handling II Bar Graphs and Histograms, Exercise 2: EXERCISE with Hints & Solutions
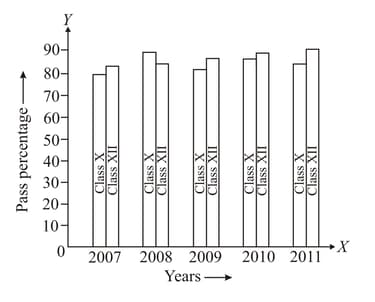
Read the double bar graph given and answer the following question.
In which year is the pass percentage of Class more as compared to Class
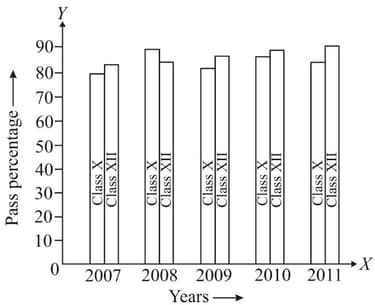
Read the double bar graph given in figure and answer the question.
In which year is the difference between the pass percentage of Class and Class minimum

Find the average pass percentage of Class and Class in five years. Which class has the higher average pass percentage?
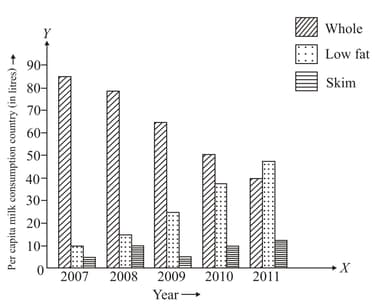
Study the bar graph given below:
What is the trend of per capita whole milk consumption in the country?
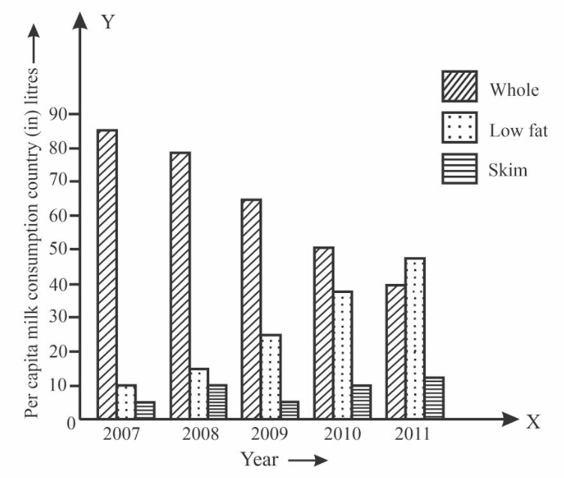
Study the bar graph given below:
What is the trend of per capita low-fat milk consumption in the country?

Study the bar graph given below:
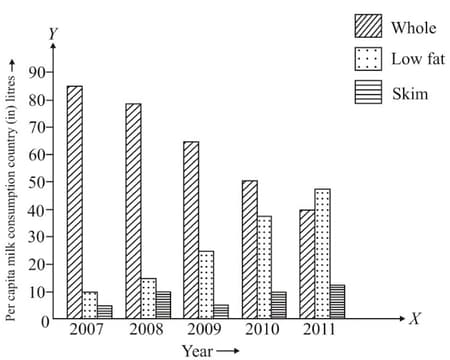
In which year did low-fat milk consumption surpass whole milk consumption?
Study the bar graph given below:
In which year is the difference between whole milk consumption and low-fat milk consumption maximum?
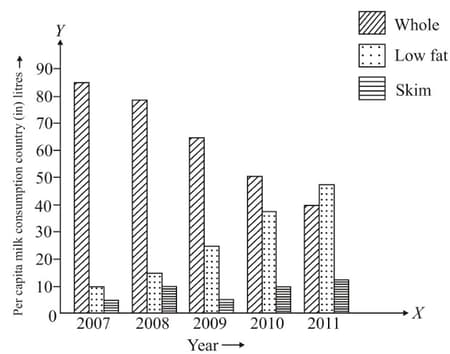
In which years was the consumption of skimmed milk same?