
Monica Capoor Solutions for Chapter: Data Handling II Bar Graphs and Histograms, Exercise 3: EXERCISE
Monica Capoor Mathematics Solutions for Exercise - Monica Capoor Solutions for Chapter: Data Handling II Bar Graphs and Histograms, Exercise 3: EXERCISE
Attempt the practice questions on Chapter 8: Data Handling II Bar Graphs and Histograms, Exercise 3: EXERCISE with hints and solutions to strengthen your understanding. Number Magic a textbook of Mathematics 8 solutions are prepared by Experienced Embibe Experts.
Questions from Monica Capoor Solutions for Chapter: Data Handling II Bar Graphs and Histograms, Exercise 3: EXERCISE with Hints & Solutions
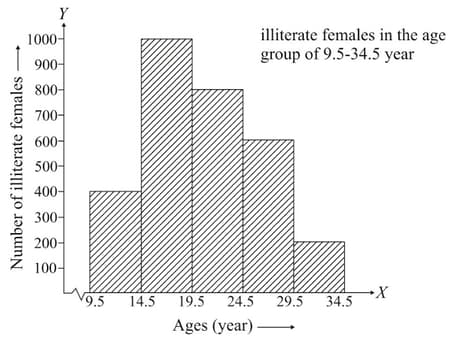
Study the histogram given in figure and answer the given question.

How many more illiterate females are there in the age group years as compared to the age group
Study the histogram given in figure and answer the given question.

What is the total number of illiterate females in the age group years?
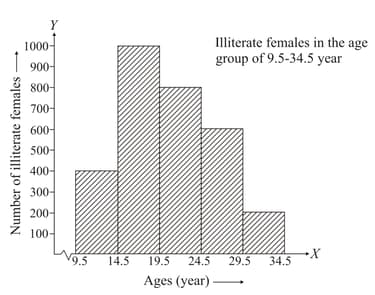
What is the ratio of the number of illiterate females in the age group years to the number of illiterate females in the age group years
What percentage of illiterate females belong to the age group years
The following histogram shows the number of runs scored by a batsman in one-day matches:
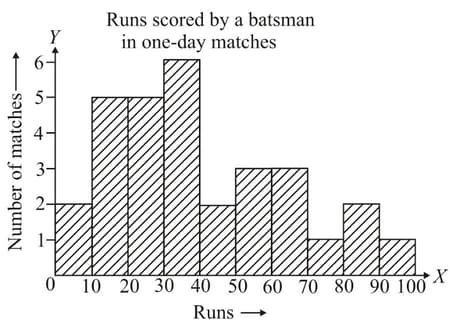
How many matches did batsman play?
The following histogram shows the number of runs scored by a batsman in one-day matches. How many matches were played in the lowest run group?
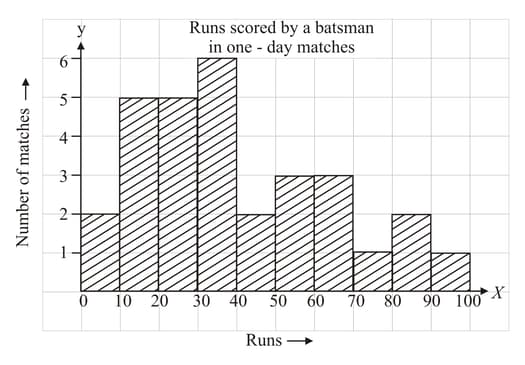
The following histogram shows the number of runs scored by a batsman in one-day matches:

In how many matches did he score or more runs?
The following histogram shows the number of runs scored by a batsman in one-day matches:

In how many matches did he score less than half a century?


