
Monica Capoor Solutions for Chapter: Data Handling III Pie Charts or Circle Graphs, Exercise 2: HOTS
Monica Capoor Mathematics Solutions for Exercise - Monica Capoor Solutions for Chapter: Data Handling III Pie Charts or Circle Graphs, Exercise 2: HOTS
Attempt the practice questions on Chapter 9: Data Handling III Pie Charts or Circle Graphs, Exercise 2: HOTS with hints and solutions to strengthen your understanding. Number Magic a textbook of Mathematics 8 solutions are prepared by Experienced Embibe Experts.
Questions from Monica Capoor Solutions for Chapter: Data Handling III Pie Charts or Circle Graphs, Exercise 2: HOTS with Hints & Solutions
Complete the table given below and then draw a pie chart to express the amount spent by five teenaged boys A, B, C, D and E on recreation, in a month.
| Boy | A | B | C | D | E | Total |
|---|---|---|---|---|---|---|
| Expenditure on recreation (in) | ||||||
| Central angle |
The given pie chart represents the different categories of wasteland in a country. If the total area of wasteland in that country is million hectares, then find the following:
The area of saline and alkaline lands.
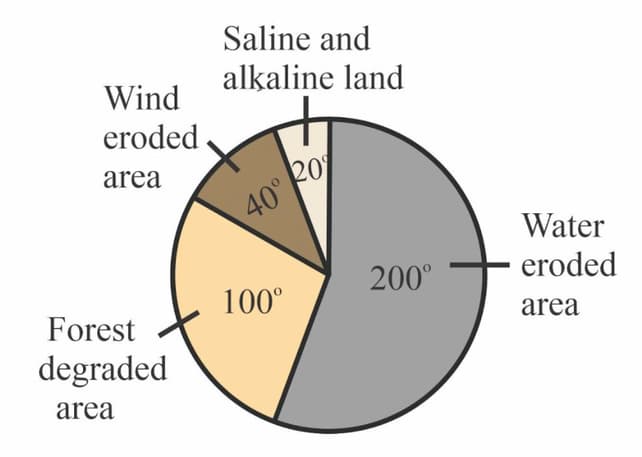
The given pie chart represents the different categories of wasteland in a country. If the total area of wasteland in that country is million hectares, then find the percentage of water eroded area. (Estimate answer to two decimal places)
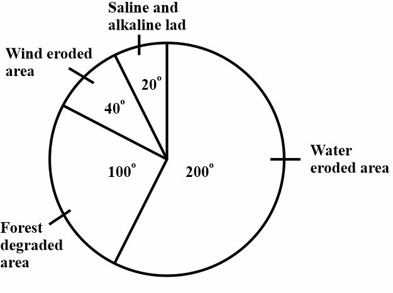
The given pie chart represents the different categories of wasteland in a country. If the total area of wasteland in that country is million hectares, then find the following:
The ratio of forest degraded area to wind eroded area.


