
Monicaa Abhijit Solutions for Chapter: Frequency Distribution and Bar Graph, Exercise 3: EXERCISE 20.3
Monicaa Abhijit Mathematics Solutions for Exercise - Monicaa Abhijit Solutions for Chapter: Frequency Distribution and Bar Graph, Exercise 3: EXERCISE 20.3
Attempt the practice questions on Chapter 20: Frequency Distribution and Bar Graph, Exercise 3: EXERCISE 20.3 with hints and solutions to strengthen your understanding. START UP MATHEMATICS solutions are prepared by Experienced Embibe Experts.
Questions from Monicaa Abhijit Solutions for Chapter: Frequency Distribution and Bar Graph, Exercise 3: EXERCISE 20.3 with Hints & Solutions
Study the following bar graph and answer the question:
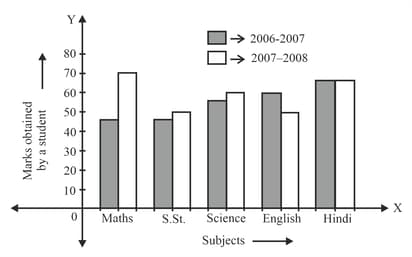
In which subject has the performance improved the most?
Study the following bar graph and answer the questions that follow:

In which subject has the performance deteriorated?
Study the following bar graph and answer the questions that follow:

In which subject is the performance at par?
The following table gives the number of students in class in a school during academic years to . Represent the data by a bar graph.
| Academic year | - | - | - | - | - |
| Number of students |
Represent the data shown in the table below in the form of a bar graph.
| Days | Monday | Tuesday | Wednesday | Thursday | Friday | Saturday | Sunday |
| Number of cold drinks sold (frequency) |
Honey recorded the types of vehicles passing on a road in hour and presented her findings in a bar graph. Study the bar graph and answer the given questions:

Name the vehicle which passed the minimum number of times.
Honey recorded the types of vehicles passing on a road in hour and presented her findings in a bar graph. Study the bar graph and answer the given questions:
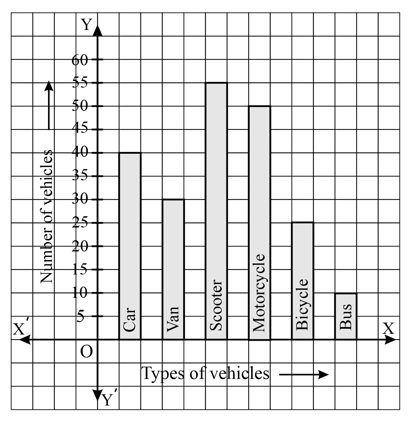
Name the vehicle which passed the miximum number of times.
The following table shows the number of books sold by two stores in five months. Draw a double bar graph representing the given data.
| Month | May | June | July | August | September |
| Sale of store | |||||
| Sale of store |


