
Monicaa Abhijit Solutions for Chapter: Histogram, Pie Chart and Line Graph, Exercise 1: EXERCISE 21.1
Monicaa Abhijit Mathematics Solutions for Exercise - Monicaa Abhijit Solutions for Chapter: Histogram, Pie Chart and Line Graph, Exercise 1: EXERCISE 21.1
Attempt the practice questions on Chapter 21: Histogram, Pie Chart and Line Graph, Exercise 1: EXERCISE 21.1 with hints and solutions to strengthen your understanding. START UP MATHEMATICS solutions are prepared by Experienced Embibe Experts.
Questions from Monicaa Abhijit Solutions for Chapter: Histogram, Pie Chart and Line Graph, Exercise 1: EXERCISE 21.1 with Hints & Solutions
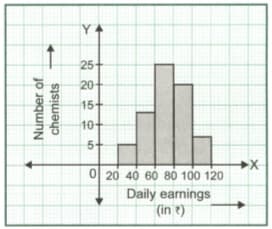
The given histogram depicts the earnings of chemists.
Study the histogram and answer the following questions:
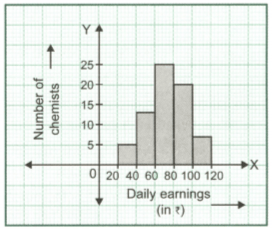
The given histogram depicts the earnings of 70 chemists.
Study the histogram and answer the following questions:
Study the given histogram and answer the questions that follow.
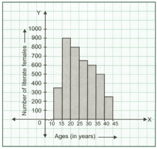
What informatiom is depicted in the above histogram?
Study the given histogram and answer the questions that follow.

In which age group is the number of literate females maximum?
Study the given histogram and answer the questions that follow.

In which age group is the number of literate female’s minimum?
Study the given histogram and answer the questions that follow.
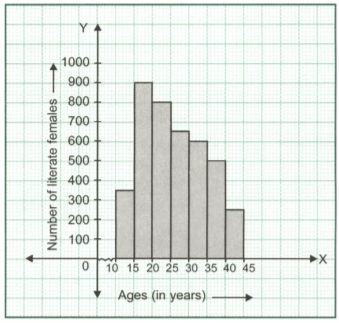
What is the width of each class interval?
Study the given histogram and answer the questions that follow.

What are the class marks of the intervals and ?
Study the given histogram and answer the questions that follow.


