
Drawing a Pictograph
Drawing a Pictograph: Overview
This topic discusses information about pictographs and their uses. It provides several steps to explain how to draw a pictograph with the aid of some examples.
Important Questions on Drawing a Pictograph
The following table shows the area of the land on which different crops were grown.
| Crop | Area of land (in million hectares) |
| Rice | |
| Wheat | |
| Pulses | |
| Sugarcane | |
| Cotton |
Prepare a pictograph by choosing a suitable symbol to represent million hectares.
Prepare a pictograph of the information given in the question.
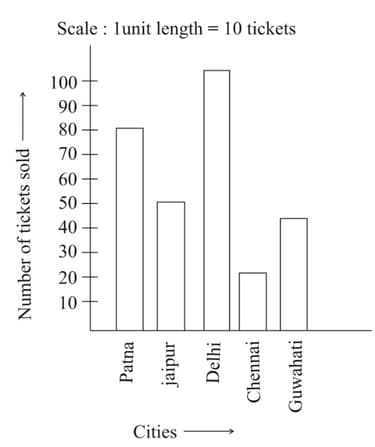
The following graph gives information about the number of railway tickets sold for different cities on a railway ticket counter between to .
Prepare a pictograph of the data by taking a suitable symbol to represent kilometers.
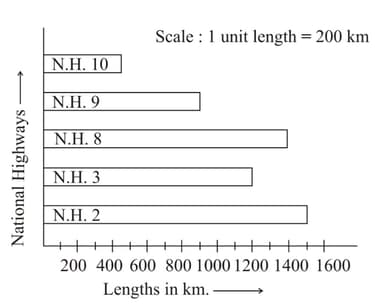
The bar graph given below represents the approximate length (in kilometres) of some National Highways in India.
Annual expenditure of a company in the year is given below:
| Items | Expenditure |
| Salaries of employees | 65 |
| Advertisement | 10 |
| Purchase of machinery | 85 |
| Electricity and water | 15 |
| Transportation | 25 |
| Other expenses | 30 |
Prepare a pictograph of the above data using an appropriate symbol to represent .
The following table gives information about the circulation of newspapers (dailies) in a town in five languages.
| Language | English | Hindi | Tamil | Punjabi | Gujarati |
| Number of newspapers |
Prepare a pictograph of the above data, using a symbol of your choice, each representing newspapers.
The number of bottles of cold drinks sold by a shopkeeper on six consecutive days is as follows:
| Day | Sunday | Monday | Tuesday | Wednesday | Thursday | Friday |
| Number of bottles |
Prepare a pictograph of the data using one symbol to represent bottles.


