
Use of Bar Graphs with a Different Purpose
Important Questions on Use of Bar Graphs with a Different Purpose
What is the difference between a bar graph and a histogram.
The following problem shows average intake of nutrients in calories by rural and urban groups in a particular year. Using a suitable scale for the given data draw a double bar graph to represent the data.
| Foodstuffs | Rural | Urban |
| Pulse | ||
| Leafy Vegetables | ||
| Other Vegetables | ||
| Fruits | ||
| Milk | ||
| Fish &Flesh Foods | ||
| Fats and Oils | ||
| Sugar/Jaggery |
Study the bar graph given below and answer the question that follow

Calculate the percentage of marks the student got out of
Study the bar graph given below and answer the questions that follow :
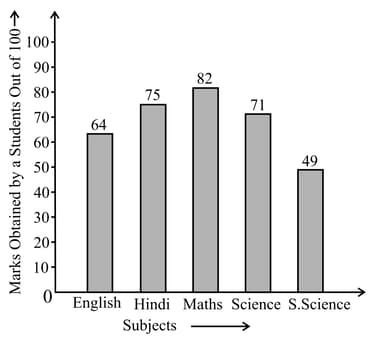
Calculate the average marks of the student.
Study the bar graph given below and answer the questions that follow :

In which subject is the student very good?
Study the bar graph given below and answer the questions that follow:

Find difference of rice production between years and .
Study the bar graph given below and answer the questions that follow:
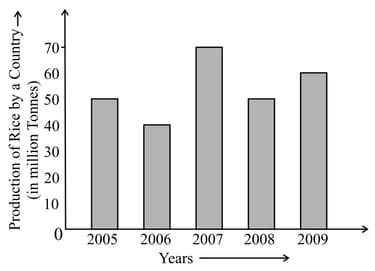
Find the average production of rice during the years.
Study the bar graph given below and answer the questions that follow:

After which year was the maximum rise in the production?
Study the bar graph given below and answer the questions that follow:

In which year was production the least?
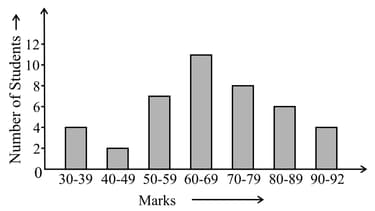
The bar graph given below shows the marks of students of a class in a particular subject:

Study the bar graph and answer the question:
What is the strength of the class?
The bar graph given below shows the marks of students of a class in a particular subject:
Study the bar graph and answer the question:
If students who scored marks above are given merits then how many merit holders are there?
The bar graph given below shows the marks of students of a class in a particular subject:

Study the bar graph and answer the following questions:
How many students scored marks and above?
The bar graph given below shows the marks of students of a class in a particular subject:

Study the bar graph and answer the following questions:
How many students got marks from to
The bar graph given below shows the marks of students of a class in a particular subject:

Study the bar graph and answer the following questions:
If is the pass mark, then how many students have failed?
Observe the given bar graph carefully and answer the questions that follow.
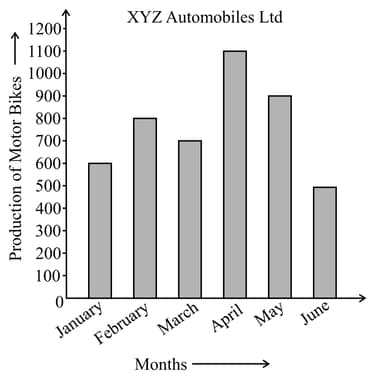
Calculate the average (mean) production of bikes in months.
Observe the given bar graph carefully and answer the questions that follow.

Calculate the increase in production in May over the production in January.
The data given below shows the production of motor bikes in a factory for some months of two consecutive years.
| Months | Feb | May | August | October | December |
Study the table given above and answer the following questions:
In which month for the year the production was the least?
Observe the given bar graph carefully and answer the questions that follow.
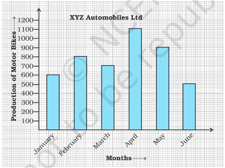
How many motor bikes were produced in the first three months?
Study the double bar graph and answer the questions that follow:
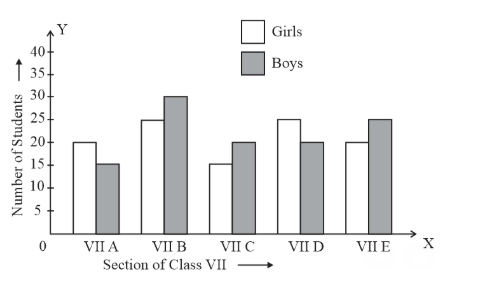
In which section, the number of girls is the least
Study the double bar graph and answer the questions that follow:
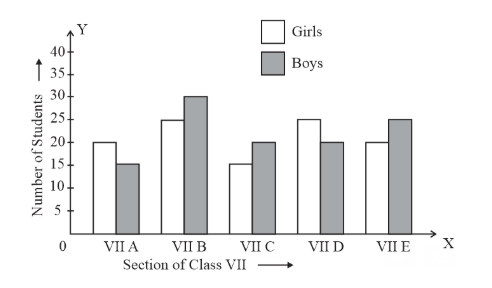
In which section, the number of boys is the maximum


