
NCERT Solutions for Chapter: Data Handling, Exercise 1: Exercise
NCERT Mathematics Solutions for Exercise - NCERT Solutions for Chapter: Data Handling, Exercise 1: Exercise
Attempt the practice questions on Chapter 5: Data Handling, Exercise 1: Exercise with hints and solutions to strengthen your understanding. Mathematics Textbook of Competency Based Questions for Class VIII solutions are prepared by Experienced Embibe Experts.
Questions from NCERT Solutions for Chapter: Data Handling, Exercise 1: Exercise with Hints & Solutions
If a dice is rolled, then find the probability of getting a composite number.
The following steps are involved in solving the above problem. Arrange them in sequential order
(A) The possible composite numbers when a dice is rolled are and . When a dice is rolled, the possible outcomes are
(B) The required probability
(C) The probability of getting a composite number
In a cards game, there are ten cards, to . Two players, seated facing each other, randomly choose cards each. They arrange their cards in ascending order of the number on the card as shown below.
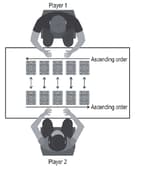
The difference between the corresponding cards is calculated such that the lower value is subtracted from the higher value.
In a random game, what is the probability that the sum of the differences is ?
List all the possible outcomes of tossing three coins together.
For an unbiased coin, the probability of getting a tail is
Record the weights of candidates of the class and represent this information with the help of a bar graph.
In a box, there are marbles. Each marble is marked with a distinct number from to . Find the probability of drawing a marble from the box which is marked with a number that is perfect square.
In a pie-chart, find the central angle of a component, which is in the total value of all the components
A business concern spends its expenses under various heads as under.
Salary for employees - (thousand)
Travelling for purchases - (thousand)
Equipments - (thousand)
Rent for the premises - (thousand)
Cost of raw materials - (thousand)
Transportation of finished products - (thousand)
Miscellaneous - (thousand)
Draw a pie graph depicting the above data.


