
NCERT Solutions for Chapter: Introduction to Graphs, Exercise 1: Exercise
NCERT Mathematics Solutions for Exercise - NCERT Solutions for Chapter: Introduction to Graphs, Exercise 1: Exercise
Attempt the practice questions on Chapter 15: Introduction to Graphs, Exercise 1: Exercise with hints and solutions to strengthen your understanding. Mathematics Textbook of Competency Based Questions for Class VIII solutions are prepared by Experienced Embibe Experts.
Questions from NCERT Solutions for Chapter: Introduction to Graphs, Exercise 1: Exercise with Hints & Solutions
The following table shows the rainfall recorded for the same duration in two cities:
| Week | Week | Week | Week | Week | |
| City | |||||
| City |
Plot the graph. Find the average rainfall for both the cities.
Construct a pie chart to depict the given data.
| Subject | Mathematics | English | Science | EVS |
| Marks obtained by suman |
The following table shows the number of child births per population of a state per year for every decade from to .
| Year | |||||
| Child birth rate |
Draw a line graph to represent the data.
The number of hours devoted to studies in a day by students of a particular class as follows:
Prepare a frequency distribution table and represent the data using histogram.
The bar graph shows the number of hours spent by a programmer on computers per week. Read the graph carefully and answer the following question:

The median of the weekly time spent on computers is _____ hours.
Read the following bar graph and answer the questions
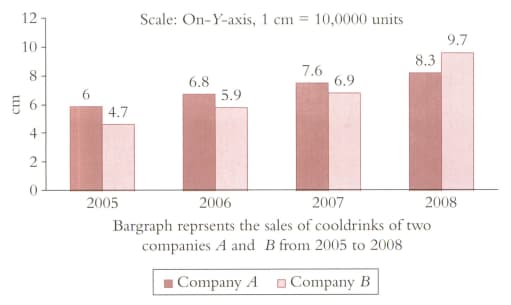
In which year is the difference between the sales of and sales of the highest?
The daily wages of workers working in a factor are as follows:
Represent the above data in the form of a frequency distribution with class size as .
The bar graph shows the number of hours spent by a programmer on computers per week. Read the graph carefully and answer the following question:
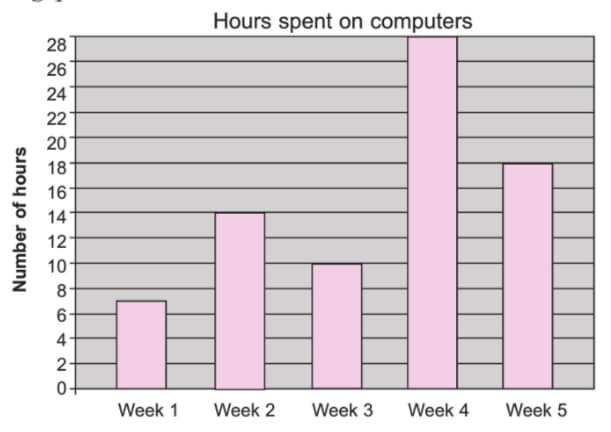
The ratio of the number of hours spent in the first week to that of the number of hours spent in the second week is _____.


