
Water Pollution
Important Questions on Water Pollution
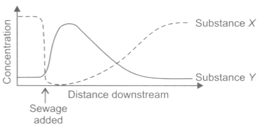
The given graph shows changes in concentration of two substances and in river polluted by sewage. Which of the following options most appropriately identifies and ?
The given figure shows a river and the types of land use on the sides of the river. The water quality of the river was studied by measuring the amounts of dissolved oxygen and ammonia in the water collected at sites and . The results are given below:
| Site | Dissolved oxygen |
Ammonia (ppm) |
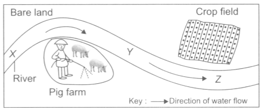
Which of the following is correct regarding this?
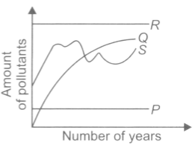
The given graph shows the amount of pollutants in four rivers and . The river that can continue to support the most number of aquatic plants and animals is _____.
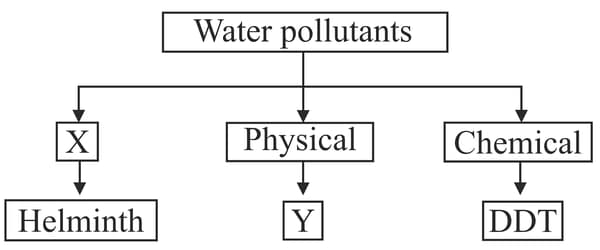
Select the option that correctly identifies and in the given flow chart.
| (A) | Ecological | BHC |
| (B) | Biological | Fertiliser |
| (C) | Biological | Heat |
| (D) | Ecological | Bacteria |
The phenomenon of increase in concentration of non-biodegradable organic compounds with each trophic level in a food chain is called


