
Natasha Awada, Paul La Rondie, Laurie Buchanan and, Jill Stevens Solutions for Chapter: Representing Data: Statistics for Univariate Data, Exercise 19: Exercise 6D
Natasha Awada Mathematics Solutions for Exercise - Natasha Awada, Paul La Rondie, Laurie Buchanan and, Jill Stevens Solutions for Chapter: Representing Data: Statistics for Univariate Data, Exercise 19: Exercise 6D
Attempt the free practice questions on Chapter 6: Representing Data: Statistics for Univariate Data, Exercise 19: Exercise 6D with hints and solutions to strengthen your understanding. Mathematics : Analysis and Approaches Standard Level Course Companion solutions are prepared by Experienced Embibe Experts.
Questions from Natasha Awada, Paul La Rondie, Laurie Buchanan and, Jill Stevens Solutions for Chapter: Representing Data: Statistics for Univariate Data, Exercise 19: Exercise 6D with Hints & Solutions
The bar chart shows the number of children per family in a selection of families.
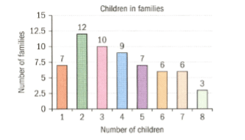
Find the mean number of children per family, to the nearest tenth.
The histogram represents the ages of the people in a village.
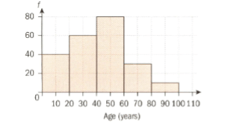
How many people are there in the village?.
The histogram represents the ages of the people in a village.

The modal class of the distribution is given by , then find .
The histogram represents the ages of the people in a village.

Find the mean age.(Answer upto two decimals).
If the mode of this set of numbers is and the mean is , find the sum of the values of and .
The mean of and is . Find the value of .
The mean of . Find the value of .
In an IB class, there are boys and girls. The mean mass of the boys is and the mean mass of the girls is . What is the mean mass of the whole class of students?


