Natasha Awada, Paul La Rondie, Laurie Buchanan and, Jill Stevens Solutions for Chapter: Representing Data: Statistics for Univariate Data, Exercise 29: Exercise 6G
Natasha Awada Mathematics Solutions for Exercise - Natasha Awada, Paul La Rondie, Laurie Buchanan and, Jill Stevens Solutions for Chapter: Representing Data: Statistics for Univariate Data, Exercise 29: Exercise 6G
Attempt the free practice questions on Chapter 6: Representing Data: Statistics for Univariate Data, Exercise 29: Exercise 6G with hints and solutions to strengthen your understanding. Mathematics : Analysis and Approaches Standard Level Course Companion solutions are prepared by Experienced Embibe Experts.
Questions from Natasha Awada, Paul La Rondie, Laurie Buchanan and, Jill Stevens Solutions for Chapter: Representing Data: Statistics for Univariate Data, Exercise 29: Exercise 6G with Hints & Solutions
The number of students in international schools in the country of Portmany is shown below.
Given that is an outlier. State a reason to remove the outlier.
Test scores for an IB morning exam are:
,
Test scores for an IB afternoon exam are:
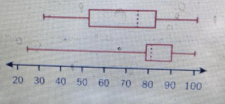
Draw a box-and-whisker plot for each data set. Use one number line for both plots, and draw one above the other.
Test scores for an IB morning exam are:
,
Test scores for an IB afternoon exam are:
Given a box-and-whisker plot for each data set using one number line for both plots, having the test scores for an IB morning exam first and under it lies the test scores of IB afternoon scores box plot.
State which examination has the greatest spread for the middle .
Test scores for an IB morning exam are:
,
Test scores for an IB afternoon exam are:
Given a box-and-whisker plot for each data set using one number line for both plots, having the test scores for an IB morning exam first and under it lies the test scores of IB afternoon scores box plot.

Describe from the given that morning exam has the greatest spread for the middle , tells us about the range in performance for the two exams.
Draw bar diagram for this data:
Given:
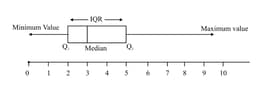
Use your to sketch a box plot.
Given:
and its box plot is
Describe the skew of the data.
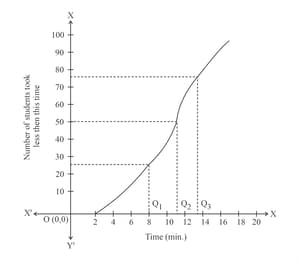
The time, in minutes, taken by students to reply to their friends on social media is shown as a cumulative frequency curve. Find the longest time taken to reply.(Answer without units)