
Pie Chart
Important Questions on Pie Chart
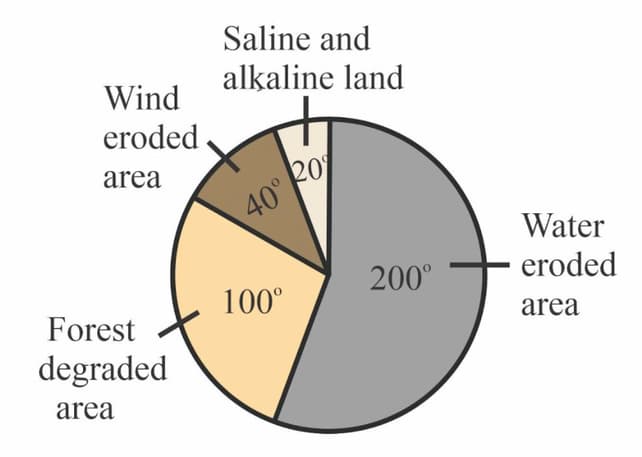
The given pie chart represents the different categories of wasteland in a country. If the total area of wasteland in that country is million hectares, then find the following:
The ratio of forest degraded area to wind eroded area.

The given pie chart represents the different categories of wasteland in a country. If the total area of wasteland in that country is million hectares, then find the percentage of water eroded area. (Estimate answer to two decimal places)
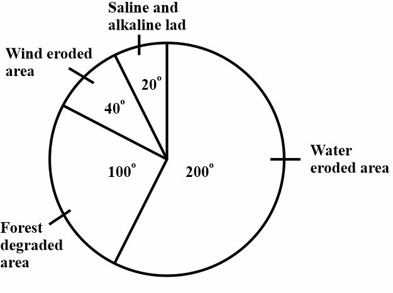
The given pie chart represents the different categories of wasteland in a country. If the total area of wasteland in that country is million hectares, then find the following:
The area of saline and alkaline lands.
Complete the table given below and then draw a pie chart to express the amount spent by five teenaged boys A, B, C, D and E on recreation, in a month.
| Boy | A | B | C | D | E | Total |
|---|---|---|---|---|---|---|
| Expenditure on recreation (in) | ||||||
| Central angle |
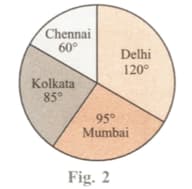
A pie chart representing the population of senior citizens in four metropolitan cities is given in Figure . If the total population of senior citizens is , read the pie chart and find the population of senior citizens in Delhi, Mumbai, Chennai and Kolkata.
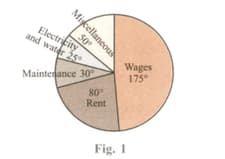
The pie chart in Figure shows the expenditure of a showroom on various heads. If the total expenditure is , find the expenditure on individual heads.
Draw a pie chart for the given data.
Given below is the percentage break-up of the cost of production of a book:
| Head | Printing | Paper and binding charges | Advertisement | Royalty | Miscellaneous |
|---|---|---|---|---|---|
| Percentage (%) |
Draw a pie chart for the given data.
The following table shows the monthly expenditure of a firm:
| Item | Rent | Wages | Electricity and Water | Taxation |
|---|---|---|---|---|
| Amount (in lakhs of ) |
Draw a pie chart for the given data.
The following table gives the number of credit cards issued by five banks in :
| Bank | Standard Chartered | ICICI | SBI | Citibank | Bank of India |
|---|---|---|---|---|---|
| Number of credit cards issued |
Draw a pie chart for the given data.
The following data represents the number of students who appeared for various subjects in an examination:
| Subject | Physics | Mathematics | English | Biology | Chemistry |
|---|---|---|---|---|---|
| Number of students |
Draw a pie chart for the given data.
The following data shows the expenditure of an individual on various items:
| Item | Education | Food | Rent | Clothing | Others |
|---|---|---|---|---|---|
| Expenditure (in ) |
Draw a pie chart for the given data.
The table given below provides the data on money spent (in crores) during the fourth 'Five Year Plan' :
| Item | Agriculture | Communication | Industries | Power | Miscellaneous |
|---|---|---|---|---|---|
| Rupees (in crores) |
Draw a pie chart for the given data.
The following table represents the collection of stamps of different countries, by a student :
| Country | India | USA | Germany | UK | South Africa |
|---|---|---|---|---|---|
| Number of stamps |
Draw a pie chart for the given data.
The following table illustrates the data on the mode of transport used by the office goers to go to their office:
| Transport to the office | Walk | Bus | Cycle | Train | Car | Total |
|---|---|---|---|---|---|---|
| Number of office goers |
Draw a pie chart for the given data.
A student spends his pocket money on various items as given below:
| Item | Books | Eatables | Stationery | Sports goods | Miscellaneous | Total |
|---|---|---|---|---|---|---|
| Money spent (in ) |
Draw a pie chart for the given data.
The marks obtained by Nayantara in an examination are given below:
| Subject | English | Hindi | Mathematics | Social Science | Science | Total |
|---|---|---|---|---|---|---|
| Marks obtained |
The selectors had to decide on the Indian team to play with Australia. They decided on the players as follows:
| Players | Wicketkeeper cum batsman | Off spinner | Leg spinner | Specialist Opening batsman | Batsman |
|---|---|---|---|---|---|
| Number |
Draw a pie chart for the given data.


