
P P Vermani, A K Bakshi and, Jyoti Bhatia Solutions for Chapter: Data Handling, Exercise 3: Exercise 15.2
P P Vermani Mathematics Solutions for Exercise - P P Vermani, A K Bakshi and, Jyoti Bhatia Solutions for Chapter: Data Handling, Exercise 3: Exercise 15.2
Attempt the free practice questions on Chapter 15: Data Handling, Exercise 3: Exercise 15.2 with hints and solutions to strengthen your understanding. Comprehensive MATHS TODAY solutions are prepared by Experienced Embibe Experts.
Questions from P P Vermani, A K Bakshi and, Jyoti Bhatia Solutions for Chapter: Data Handling, Exercise 3: Exercise 15.2 with Hints & Solutions
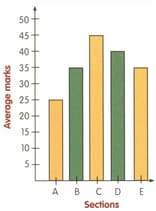
Look at the graph and answer the question given below.
Write the average mark of section out of .

Look at the graph and answer the question given below
Write the average mark of section out of .

Look at the graph and answer the question given below
Write the average mark of section out of .

Look at the graph and answer the question given below.
Write the average mark of section out of .
The following bar graph shows number of vegetarians in primary section.

Which class has the maximum number of vegetarians? Class _____
The following bar graph shows number of vegetarians in primary section. Observe the bar graph and answer the question that follows.

If the class has the minimum number of vegetarians. what is the value of ?
The following bar graph shows the number of vegetarians in the primary section. Observe the bar graph and answer the question that follows:
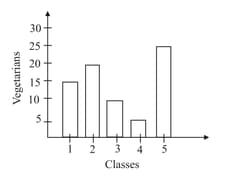
How many vegetarian students are there in all?
The following bar graph shows of number of children in various sections of class- in a school. Observe the bar graph and answer the question that follows:
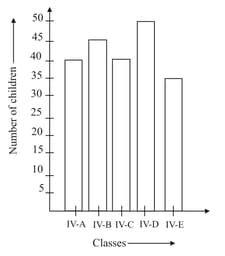
How many more children are there in than ?


