
The Hall Effect
Important Questions on The Hall Effect
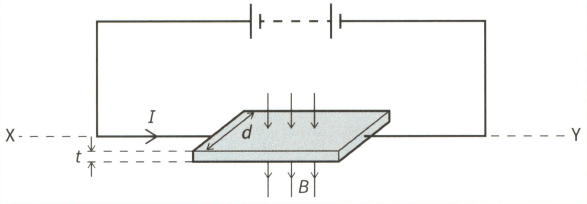
This diagram shows a thin slice of metal of thickness and width . The metal slice is in a magnetic field of flux density and carries a current , as shown.

Explain why, when the slice of metal is rotated about the horizontal axis the Hall voltage varies between a maximum positive value and a maximum negative value.
This diagram shows a thin slice of metal of thickness and width . The metal slice is in a magnetic field of flux density and carries a current , as shown.

Explain why, in terms of the movement of electrons, the Hall voltage increases when increase.
This diagram shows a thin slice of metal of thickness and width . The metal slice is in a magnetic field of flux density and carries a current , as shown.

Explain why, in terms of the movement of electrons, the Hall voltage increases when I increase.
This diagram shows a thin slice of metal of thickness and width . The metal slice is in a magnetic field of flux density and carries a current , as shown.

(c) Given that
Calculate the percentage uncertainty in the mean drift velocity v of the electrons, assuming the percentage uncertainties in the quantities are as shown.
This diagram shows a thin slice of metal of thickness and width . The metal slice is in a magnetic field of flux density and carries a current , as shown.

Given that the Hall voltage across the metal slice.
This diagram shows a thin slice of metal of thickness and width . The metal slice is in a magnetic field of flux density and carries a current , as shown.

Derive an expression for the Hall voltage in terms of the number density of the charge carriers in the metal and the charge on an electric iron.
This diagram shows a thin slice of metal of thickness and width . The metal slice is in a magnetic field of flux density and carries a current , as shown.

Copy the diagram and mark where a voltmeter needs to be placed to measure the Hall voltage.
This diagram shows a thin slice of metal of thickness and width . The metal slice is in a magnetic field of flux density and carries a current , as shown.
Copy the diagram and mark the slice that becomes negative because of the Hall effect.
This diagram shows a thin slice of semiconductor material carrying a current in a magnetic field at right angles to the current.

(b) The Hall voltage is measured using the same slice of semiconductor, the same current and the same magnetic field, but with the laboratory at two temperatures, one significantly higher than the other. Describe and explain the changes in the magnitude of the number density, the drift velocity of the charge carriers and the Hall voltage in the two experiments.
This diagram shows a thin slice of semiconductor material carrying a current in a magnetic field at right angles to the current.
(a) The current in the slice is due to the movement of free electrons.
(i) Add and signs to the diagram to show the charge separation caused by the Hall effect. Explain why the charges separate.
The charge-to-mass ratio for the electron is . Calculate the mass of the electron using
Suggest how the Hall effect could be used to determine the number density of charge carriers n in a semiconducting material.
A Hall probe is designed to operate with a steady current of in a semiconductor slice of thickness . The number density of charge carriers (electrons) in the semiconductor is .
(b) Explain why the current in the Hall probe must be maintained at a constant value.
A Hall probe is designed to operate with a steady current of in a semiconductor slice of thickness . The number density of charge carriers (electrons) in the semiconductor is .
(a) Calculate the Hall voltage that will result when the probe is placed at right angles to a magnetic field of flux density . (Elementary chargee)


