
David Sang and Graham Jones Solutions for Chapter: Capacitance, Exercise 3: Questions
David Sang Physics Solutions for Exercise - David Sang and Graham Jones Solutions for Chapter: Capacitance, Exercise 3: Questions
Attempt the practice questions on Chapter 23: Capacitance, Exercise 3: Questions with hints and solutions to strengthen your understanding. Physics for Cambridge International AS & A Level Coursebook 3rd Edition Digital Access solutions are prepared by Experienced Embibe Experts.
Questions from David Sang and Graham Jones Solutions for Chapter: Capacitance, Exercise 3: Questions with Hints & Solutions
State the quantity represented by the gradient of the straight line shown in Figure.
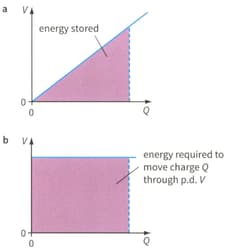
The area under a graph of voltage against charge gives a quantity of energy. The area in figure shows the energy stored in a capacitor; the area in figure shows the energy required to drive a charge through a resistor.
The graph of Figure shows how Depends on For a particular capacitor.
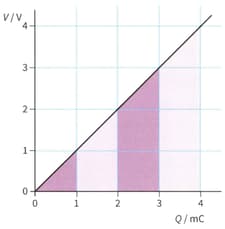
The energy stored by a capacitor is equal to the area under the graph of voltage against charge.
The area under the graph has been divided into strips to make it easy to calculate the energy stored. The first strip (which is simply a triangle) shows the energy stored when the capacitor is charged up to . The energy stored is . Calculate the capacitance Of the capacitor.
The graph of Figure shows how Depends on for a particular capacitor.

The energy stored by a capacitor is equal to the area under the graph of voltage against charge.
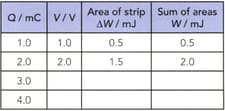
The area under the graph has been divided into strips to make it easy to calculate the energy stored. The first strip (which is simply a triangle) shows the energy stored when the capacitor is charged up to . The energy stored is Copy the table given below and complete it by calculating the areas of successive strips, to show how depends on .
The graph of Figure shows how depends on for a particular capacitor.

The energy stored by a capacitor is equal to the area under the graph of voltage against charge.
The area under the graph has been divided into strips to make it easy to calculate the energy stored. The first strip (which is simply a triangle) shows the energy stored when the capacitor is charged up to . The energy stored is . Plot a graph of W against V. Describe the shape of this graph.
| Q / mC | V / V | Area of strip ΔW / mJ |
Sum of areas W / mJ |
| 1.0 | 1.0 | 0.5 | 0.5 |
| 2.0 | 2.0 | 1.5 | 2.0 |
| 3.0 | |||
| 4.0 |


