
David Sang and Graham Jones Solutions for Chapter: Oscillations, Exercise 8: Questions
David Sang Physics Solutions for Exercise - David Sang and Graham Jones Solutions for Chapter: Oscillations, Exercise 8: Questions
Attempt the practice questions on Chapter 18: Oscillations, Exercise 8: Questions with hints and solutions to strengthen your understanding. Physics for Cambridge International AS & A Level Coursebook 3rd Edition Digital Access solutions are prepared by Experienced Embibe Experts.
Questions from David Sang and Graham Jones Solutions for Chapter: Oscillations, Exercise 8: Questions with Hints & Solutions
Figure shows the displacement- time graph for an oscillating mass. Use the graph to determine Period.
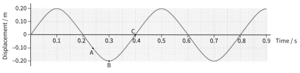
A displacement-time graph
Figure shows the displacement- time graph for an oscillating mass. Use the graph to determine the frequency.

A displacement-time graph
Figure shows the displacement- time graph for an oscillating mass. Use the graph to determine the angular frequency.

A displacement-time graph
Figure shows the displacement- time graph for an oscillating mass. Use the graph to determine the displacement at A

A displacement-time graph
Figure shows the displacement- time graph for an oscillating mass. Use the graph to determine the velocity at B

A displacement-time graph
Figure shows the displacement- time graph for an oscillating mass. Use the graph to determine the velocity at C.

A displacement-time graph
An atom in a crystal vibrates with s.h.m. with a frequency of . The amplitude of its motion is
Sketch a graph to show how the displacement of the atom varies during one cycle.
An atom in a crystal vibrates with s.h.m. with a frequency of . The amplitude of its motion is . Use the graph to estimate the maximum velocity of the atom.


