
David Sang and Graham Jones Solutions for Chapter: Thermal Physics, Exercise 8: Questions
David Sang Physics Solutions for Exercise - David Sang and Graham Jones Solutions for Chapter: Thermal Physics, Exercise 8: Questions
Attempt the free practice questions on Chapter 19: Thermal Physics, Exercise 8: Questions with hints and solutions to strengthen your understanding. Physics for Cambridge International AS & A Level Coursebook 3rd Edition Digital Access solutions are prepared by Experienced Embibe Experts.
Questions from David Sang and Graham Jones Solutions for Chapter: Thermal Physics, Exercise 8: Questions with Hints & Solutions
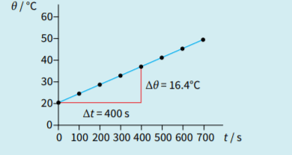
At higher temperatures than shown, the graph. deviates increasingly from a straight line. Suggest an explanation for this.
In measurements of the specific heat capacity of a metal, energy losses to the surroundings are a source of error. Is this a systematic error or a random error? Justify your answer.
In an experiment to measure the specific heat capacity of water, a student uses an electrical heater to heat some water. His results are shown. Calculate a value for the heat capacity of water. Comment on any likely sources of error.
mass of beaker = 150 g
mass of beaker + water = 672 g
current in the heater = 3.9 A
p.d. across the heater =11.4V
initial temperature = 18.5 oc
final temperature = 30.2 oc
time taken = 13.0min
A block of paraffin wax was heated gently, at a steady rate. Heating was continued after the wax had completely melted. The graph shows how the material's temperature varied during the experiment.
For each section of the graph (AB, BC and CD), describe the state of the material.
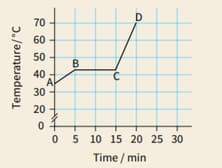
A block of paraffin wax was heated gently, at a steady rate. Heating was continued after the wax had completely melted. The graph shows how the material's temperature varied during the experiment.
For each section, explain whether the material's internal energy is increasing, decreasing or remaining constant.
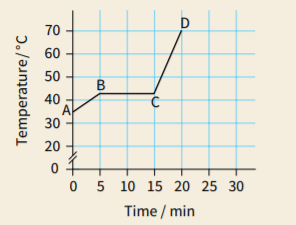
A block of paraffin wax was heated gently, at a steady rate. Heating was continued after the wax had completely melted. The graph shows how the material's temperature varied during the experiment.
Consider the two sloping sections of the graph.State whether the material's specific heat capacity is greater when it is a solid or when it is a liquid. Justify your answer.
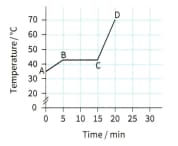
Temperature variation of a sample of wax, heated at a constant rate.


