
R. D. Sharma Solutions for Chapter: Data Handling-II (Graphical Representation of Data as Histograms), Exercise 1: EXERCISE
R. D. Sharma Mathematics Solutions for Exercise - R. D. Sharma Solutions for Chapter: Data Handling-II (Graphical Representation of Data as Histograms), Exercise 1: EXERCISE
Attempt the practice questions on Chapter 24: Data Handling-II (Graphical Representation of Data as Histograms), Exercise 1: EXERCISE with hints and solutions to strengthen your understanding. Mathematics for Class 8 solutions are prepared by Experienced Embibe Experts.
Questions from R. D. Sharma Solutions for Chapter: Data Handling-II (Graphical Representation of Data as Histograms), Exercise 1: EXERCISE with Hints & Solutions
The following histogram shows the number of literate females in the age group of to years in a town:
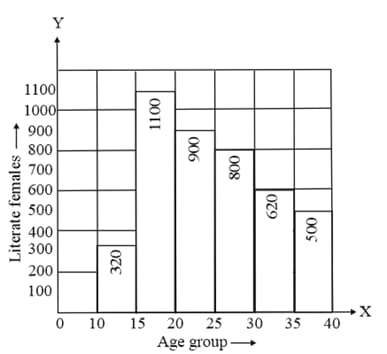
What is the class width?
The following histogram shows the number of literate females in the age group of to years in a town:
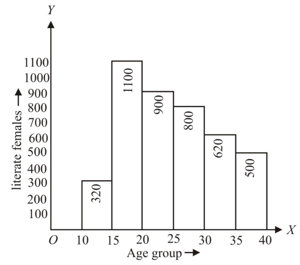
What is the lowest frequency?
The following histogram shows the number of literate females in the age group of to years in a town:
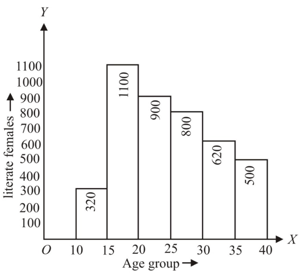
In which age group literate females are the least?
The following histogram shows the monthly wages (in) of workers in a factory:
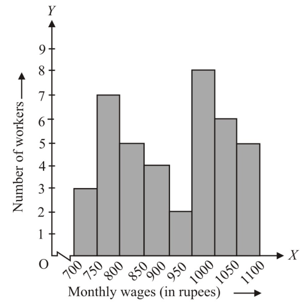
What is the total number of workers?
The following histogram shows the monthly wages (in ) of workers in a factory:
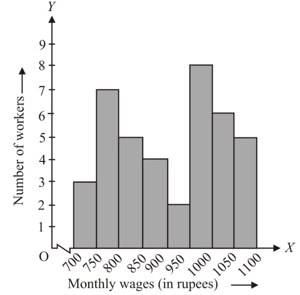
What is the factory size?
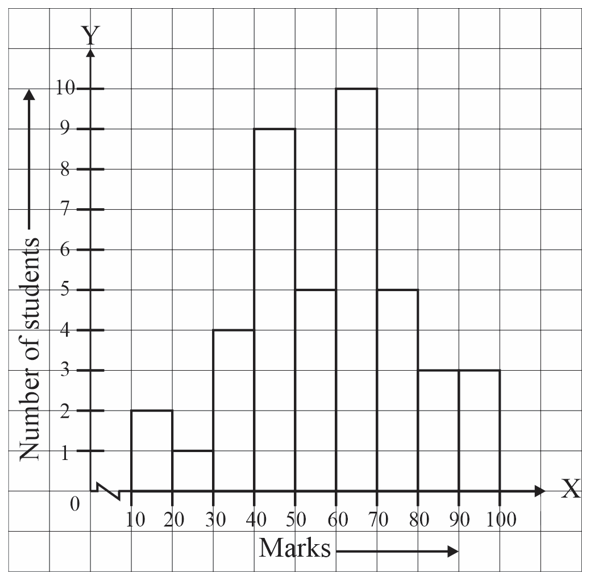
Below is the histogram depicting marks obtained by students of a class. Find the number of students getting the highest marks.
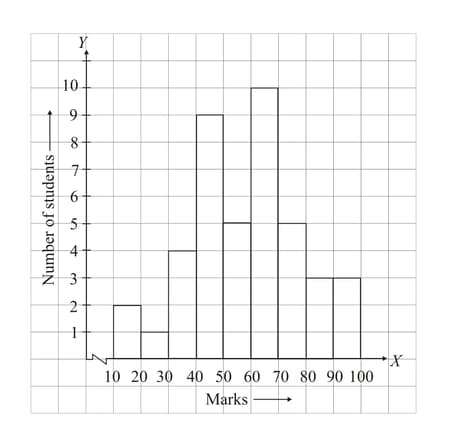
Below is the histogram depicting marks obtained by students of a class:
What is the class size?
The following histogram shows the frequency distribution of the ages of teachers in a school:
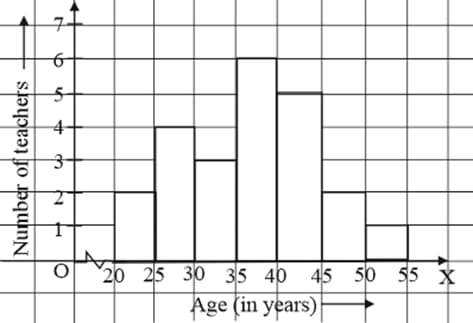
What is the size of the classes?


