
Rose Harrison and Clara Huizink Solutions for Exercise 17: Mixed practice
Rose Harrison Mathematics Solutions for Exercise - Rose Harrison and Clara Huizink Solutions for Exercise 17: Mixed practice
Attempt the practice questions from Exercise 17: Mixed practice with hints and solutions to strengthen your understanding. MYP Mathematics A concept based approach 4&5 Standard solutions are prepared by Experienced Embibe Experts.
Questions from Rose Harrison and Clara Huizink Solutions for Exercise 17: Mixed practice with Hints & Solutions
The heights of -year-old students from Sri Lanka and Peru are given in the frequency tables below.
| Heights of students in Sri Lanka (measured to the nearest cm) | Frequency |
| Heights of students in Peru (measured to the nearest cm) | Frequency |
Explain why it is necessary to construct a relative frequency histogram to compare these data sets.
The heights of -year-old students from Sri Lanka and Peru are given in the frequency tables below.
| Heights of students in Sri Lanka (measured to the nearest cm) | Frequency |
| Heights of students in Peru (measured to the nearest cm) | Frequency |
Comment on the distributions of the heights of -year-old students in Sri Lanka and Peru.
In New Zealand, mothers were asked how old they were when they had their first child. The frequency table gives the results.
| Age, (years) | Frequency |
Construct the histogram.
In New Zealand, mothers were asked how old they were when they had their first child. The frequency table gives the results.
| Age, (years) | Frequency |
Calculate an estimate for the mean and determine the modal class.
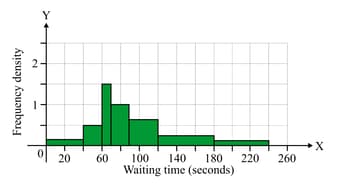
The histogram shows the waiting times for some customers at a supermarket.

Frequency density value at interval is , is , is , is
State the modal class.
The histogram shows the waiting times for some customers at a supermarket.

Frequency density value at interval is , is , is , is
Calculate an estimate for the mean waiting time in seconds rounded off to two decimal places.
The histogram shows the waiting times for some customers at a supermarket.

Frequency density value at interval is , is , is , is
Find the total number of customers.
The histogram shows the waiting times for some customers at a supermarket.
Frequency density value at interval is , is , is , is
Find an estimate for the number of customers who had to wait between and seconds, and also find who had to wait longer than minutes.


