
Rose Harrison and Clara Huizink Solutions for Exercise 16: Practice 5
Rose Harrison Mathematics Solutions for Exercise - Rose Harrison and Clara Huizink Solutions for Exercise 16: Practice 5
Attempt the practice questions from Exercise 16: Practice 5 with hints and solutions to strengthen your understanding. MYP Mathematics A concept based approach 4&5 Standard solutions are prepared by Experienced Embibe Experts.
Questions from Rose Harrison and Clara Huizink Solutions for Exercise 16: Practice 5 with Hints & Solutions
The doctors at a medical center see patients in total during morning surgery. The table gives information about the lengths of these appointments in minutes.
| Length, (min) | Frequency |
Construct a frequency density histogram for the information.
The doctors at a medical center see patients in total during morning surgery. The table gives information about the lengths of these appointments in minutes.
| Length, (min) | Frequency |
Calculate an estimate for the number of patients who saw their doctor for between and minutes.
Number of patients should be a integer without any decimal places, so round it off to zero decimal places.
The table shows the times taken by members of a cycling club to finish a charity ride.
| Time, (min) | Frequency |
Construct a frequency density histogram for the information.
The table shows the times taken by members of a cycling club to finish a charity ride.
| Time, (min) | Frequency |
State the modal class.
The table shows the times taken by members of a cycling club to finish a charity ride.
| Time, (min) | Frequency |
Calculate an estimate for the number of cyclists who took between and hours to complete the ride.
Given the answer by rounding off to zero decimal places.
The histogram represents the distances students threw the javelin on school sports day.
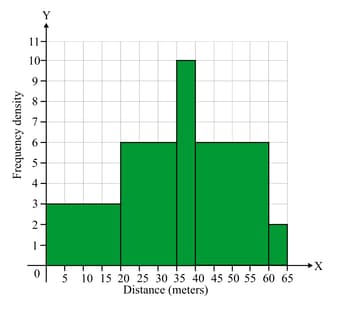
Find the class interval that contains the median.
This histogram represents children's heights. Fifteen children measured between and .
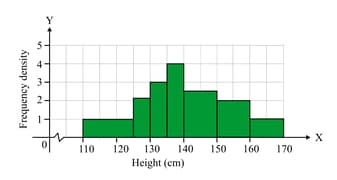
Frequency density at interval is and at is .
Find the number of children in the sample.
In a histogram, a bar of width and height represents a frequency of . A second bar is wide and represents a frequency of . Calculate the height of this bar in .


