
Rose Harrison, Clara Huizink, Aidan Sproat Clements and, Marlene Torres Skoumal Solutions for Exercise 18: Practice 6
Rose Harrison Mathematics Solutions for Exercise - Rose Harrison, Clara Huizink, Aidan Sproat Clements and, Marlene Torres Skoumal Solutions for Exercise 18: Practice 6
Attempt the free practice questions from Exercise 18: Practice 6 with hints and solutions to strengthen your understanding. Extended MYP Mathematics A Concept based approach Years 4 & 5 solutions are prepared by Experienced Embibe Experts.
Questions from Rose Harrison, Clara Huizink, Aidan Sproat Clements and, Marlene Torres Skoumal Solutions for Exercise 18: Practice 6 with Hints & Solutions
The graph shows how a buoy's distance from the ocean floor changes with the waves. Find a sinusoidal function that models the graph.
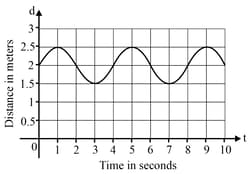
Find a sinusoidal function that models the relationship shown in the graph.
.png)
The height in meters of the tide above the mean sea level on one day at Bal Harbour can be modelled by the function , where is the number of hours after midnight. Find when and hours.
The height in meters of the tide above the mean sea level on one day at Bal Harbour can be modelled by the function , where is the number of hours after midnight. Draw the graph of the function for a hour cycle.
The height in meters of the tide above the mean sea level on one day at Bal Harbour can be modelled by the function , where is the number of hours after midnight. Determine the time of high tides and their maximum height.
The height in meters of the tide above the mean sea level on one day at Bal Harbour can be modelled by the function , where is the number of hours after midnight. Determine the height of the tide at clock in the afternoon.
The height in meters of the tide above the mean sea level on one day at Bal Harbour can be modelled by the function , where is the number of hours after midnight. A ship can cross the harbour if the tide is at least above the average sea level. Determine the time when it can cross the harbour.
The water level at high tide in Italy was , and later at low tide, the water level was . Assume that the next high tide is after hours and the height of the water level can be modelled with a sinusoidal function. Find a function that models this situation.


