S K Gupta and Anubhuti Gangal Solutions for Chapter: Graphical Representation of Data, Exercise 3: Exercise 24(C)
S K Gupta Mathematics Solutions for Exercise - S K Gupta and Anubhuti Gangal Solutions for Chapter: Graphical Representation of Data, Exercise 3: Exercise 24(C)
Attempt the practice questions on Chapter 24: Graphical Representation of Data, Exercise 3: Exercise 24(C) with hints and solutions to strengthen your understanding. ICSE NUMBERS WIZ solutions are prepared by Experienced Embibe Experts.
Questions from S K Gupta and Anubhuti Gangal Solutions for Chapter: Graphical Representation of Data, Exercise 3: Exercise 24(C) with Hints & Solutions
Draw the pie chart to represent the following information, first working out the angles.
The number of books lent out by a school library each day
| Days | Mon | Tues | Wed | Thurs | Fri |
|---|---|---|---|---|---|
| No of books lent |
The marks obtained by a student in different subjects are shown. Draw a pie diagram showing the information.
| Subject | English | Marathi | Science | Mathematics | Social science | Hindi |
| Marks |
The number of students in a hostel speaking different languages is given below. Represent the data in a pie chart.
| Languages | Hindi | English | Marathi | Tamil | Bengali | Total |
|---|---|---|---|---|---|---|
| Number of students |
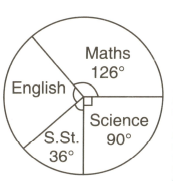
A pie diagram of the marks secured by a student in Maths, English, Physics and Chemistry is shown here. Read the graph and find the marks in Chemistry secured by the student.

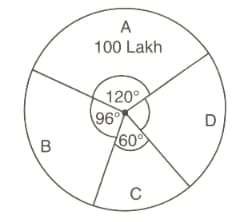
A pie chart representing the population of four cities is shown here. Read the pie chart and find the population of the city D in lakhs
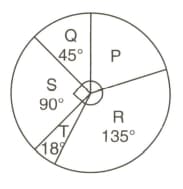
The pie chart shows the number of participants of countries and taking part in a tennis tournament. Calculate the percentage of participants
A school has a strength of students. The pie graph alongside shows the interests of students in different subjects. The number of students interested in English is