
S Purkayastha Solutions for Chapter: Data Handling, Exercise 3: CHECK POINT
S Purkayastha Mathematics Solutions for Exercise - S Purkayastha Solutions for Chapter: Data Handling, Exercise 3: CHECK POINT
Attempt the free practice questions on Chapter 17: Data Handling, Exercise 3: CHECK POINT with hints and solutions to strengthen your understanding. Maths Hub (ICSE) solutions are prepared by Experienced Embibe Experts.
Questions from S Purkayastha Solutions for Chapter: Data Handling, Exercise 3: CHECK POINT with Hints & Solutions
Draw a histogram to represent the following frequency distribution.
| Class intervals | ||||||
|---|---|---|---|---|---|---|
| Frequency |
Draw a histogram for the following data.
| Cost of living index | Total | ||||||||
|---|---|---|---|---|---|---|---|---|---|
| Number of months |
The following table gives the distribution of intelligence quotient (IQ) of pupils of class VIII in a school.
| IQ | |||||||
|---|---|---|---|---|---|---|---|
| Number of pupils |
Draw a histogram for the above data.
The given histogram depicts the marks obtained by students of a class:

What is the class size?
The given histogram depicts the marks obtained by students of a class:

How many students obtained less than marks?
The given histogram depicts the marks obtained by students of a class:

How many students obtained or more marks but less than marks?
The given histogram depicts the marks obtained by students of a class:

What is the interval of highest marks and how many students are there in this interval?
The given histogram depicts the marks obtained by students of a class:
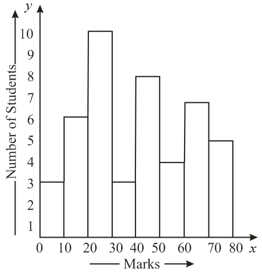
If the passing marks are what is the number failures?


