S Purkayastha Solutions for Chapter: Data Handling, Exercise 4: CHECK POINT
S Purkayastha Mathematics Solutions for Exercise - S Purkayastha Solutions for Chapter: Data Handling, Exercise 4: CHECK POINT
Attempt the free practice questions on Chapter 17: Data Handling, Exercise 4: CHECK POINT with hints and solutions to strengthen your understanding. Maths Hub (ICSE) solutions are prepared by Experienced Embibe Experts.
Questions from S Purkayastha Solutions for Chapter: Data Handling, Exercise 4: CHECK POINT with Hints & Solutions
Draw a pie diagram to represent the following data on the proposed outlay during the fourth Five-year plan.
| Items | Agriculture | Industries and minerals | Irrigation and power | Communication | Miscellaneous |
|---|---|---|---|---|---|
| (in crore) |
Draw a pie chart for the following data of expenditure pattern in a family.
| Items | Food | Clothing | Rent | Education | Miscellaneous |
|---|---|---|---|---|---|
| Expenditure |
Represent the following data by pie chart:
| Item of Expenditure | Expenditure | |
| Family A | Family B | |
| Food | ||
| Clothing | ||
| Rent | ||
| Education | ||
| Miscellaneous | ||
| Total | ||
The following shows how a student spends his pocket money during the course of a month. Represent it by a pie diagram.
| Item | Food | Entertainment | Other expenditures | Savings |
|---|---|---|---|---|
| Expenditure |
The following data show the number of students opting for different subjects in a college:
| Subject | English | Maths | Physics | Chemistry | Economics | Commerce |
|---|---|---|---|---|---|---|
| Number of students |
Draw a pie chart of the areas of continents of the world given in the following table:
| Continents | Asia | Antarctica | Africa | Europe | South America | North America | Australia |
|---|---|---|---|---|---|---|---|
| Area in million sq. km |
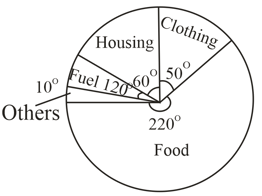
In the given pie chart represents the expenditure of a family on different items. Find the percentage expenditure on different items by reading the pie chart.
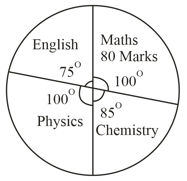
The pie chart gives the marks scored by a student in Maths, English, Physics and Chemistry. Read the diagram and find out the marks scored by the student in chemistry.