
S.N. Chhibber Solutions for Chapter: Data Handling, Exercise 2: Exercise
S.N. Chhibber Mathematics Solutions for Exercise - S.N. Chhibber Solutions for Chapter: Data Handling, Exercise 2: Exercise
Attempt the practice questions on Chapter 22: Data Handling, Exercise 2: Exercise with hints and solutions to strengthen your understanding. Joy Of Mathematics 8 solutions are prepared by Experienced Embibe Experts.
Questions from S.N. Chhibber Solutions for Chapter: Data Handling, Exercise 2: Exercise with Hints & Solutions
The production of motorcycles by a company is as follows.
| Year | |||||
|---|---|---|---|---|---|
| Motorcycles(in millions) |
Represent the above data by histogram.
The production of motorcycles by a company is as follows.
| Year | |||||
|---|---|---|---|---|---|
| Motorcycles(in millions) |
Find the percentage increase in the production of motorcycles in the year over .
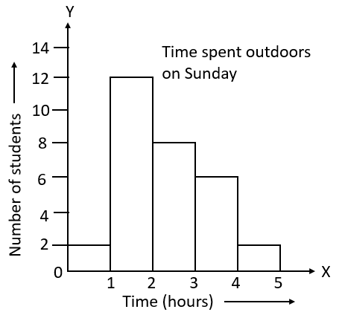
The histogram given alongside is based on the number of hours students spent outdoors on a Sunday. How many students spent more than four hours outdoors?
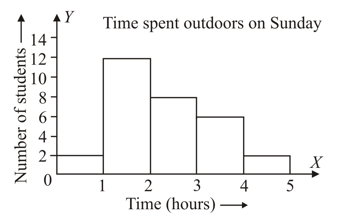
The histogram given alongside is based on the number of hours students spent outdoors on a Sunday.
How many students spent more than three hours outdoors?
The number of students in a hostel speaking different languages is given below:
| Language | English | Hindi | Punjabi | Bengali | Urdu |
| Number of students |
Display the above data in a pie chart.
The pie chart given alongside depicts the expenditure of the school on various games during the year .
If the central angle representing the expenditure on cricket is , then find the value of
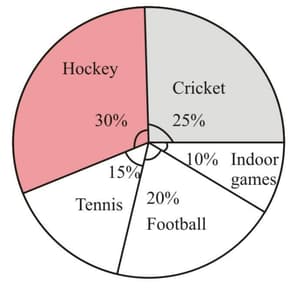
The pie chart given alongside depicts the expenditure of the school on various games during the year .
Read the pie chart and answer the following questions.
Find the two games, the expenditure on which together forms a central angle of
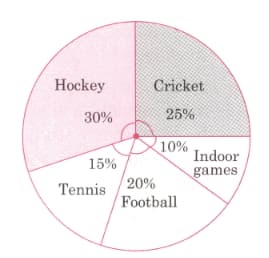
The pie chart given alongside depicts the expenditure of the school on various games during the year .
Read the pie chart and answer the following questions.
If the amount spent on football is find the amount spent on cricket and tennis.


