
Graphical Representation of Motion
Graphical Representation of Motion: Overview
This topic describes how to represent the motion of an object in a graph. In this graph, the distance is given along the y-axis and time is given along the x-axis.
Important Questions on Graphical Representation of Motion
The speed-time graph for a car is shown in figure.
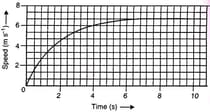
Which part of the graph represents the uniform motion of the car?
Figure shows the distance-time graph of three objects A, B and C. Study the graph and answer the following question:

How far has B travelled by the time it passes C?
Figure shows the distance-time graph of three objects A, B and C. Study the graph and answer the following question:
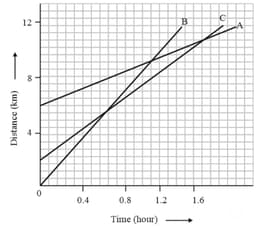
How far has C travelled when B passes A?
Figure shows the distance-time graph of three objects A, B and C. Study the graph and answer the following question:

Are all three ever at the same point on the road?
What is the quantity which is measured by the area occupied below the velocity-time graph?
What can you say about the motion of an object if its speed-time graph is a straight line parallel to the time axis?
What can you say about the motion of an object whose distance-time graph is a straight line parallel to the time axis?
What is the nature of the distance-time graphs for uniform and non-uniform motion of an object?
A train starting from a railway station and moving with uniform acceleration attains a speed in . Find its acceleration.
The speed-time graph for a car is shown in figure.
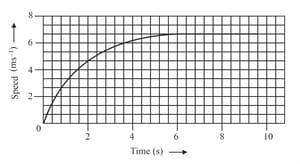
Find how far the car travels in the first . Shade, the area on the graph that represents the distance, travelled by car during the period.
Figure shows the distance-time graph of three objects A, B and C. Study the graph and answer the following question:
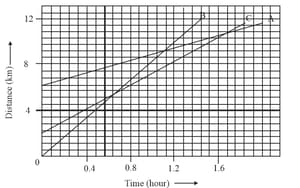
Which of the three is travelling the fastest?
A driver of a car traveling at applies the brakes and accelerates uniformly in the opposite direction.The car stops in Another driver going at in another car applies his brakes slowly and stops in On the same graph paper, plot the speed versus time graphs for the two cars. Which of the two cars travelled farther after the brakes were applied?


