
Rahul Sofat Solutions for Chapter: Data Handling, Exercise 6: SOME NCERT TEXTBOOK QUESTIONS
Rahul Sofat Mathematics Solutions for Exercise - Rahul Sofat Solutions for Chapter: Data Handling, Exercise 6: SOME NCERT TEXTBOOK QUESTIONS
Attempt the free practice questions on Chapter 9: Data Handling, Exercise 6: SOME NCERT TEXTBOOK QUESTIONS with hints and solutions to strengthen your understanding. START UP MATHEMATICS solutions are prepared by Experienced Embibe Experts.
Questions from Rahul Sofat Solutions for Chapter: Data Handling, Exercise 6: SOME NCERT TEXTBOOK QUESTIONS with Hints & Solutions
Following is the choice of sweets of students of Class .
Ladoo, Barfi, Ladoo, Jalebi, Ladoo, Rasgulla, Jalebi, Ladoo, Barfi, Rasgulla, Ladoo, Jalebi, Jalebi, Rasgulla, Ladoo, Rasgulla, Jalebi, Ladoo, Rasgulla, Ladoo, Ladoo, Barfi, Rasgulla, Rasgulla, Jalebi, Rasgulla, Ladoo, Rasgulla, Jalebi, Ladoo.
Arrange the names of sweets in a table using tally marks.
Following is the choice of sweets of students of Class .
Ladoo, Barfi, Ladoo, Jalebi, Ladoo, Rasgulla, Jalebi, Ladoo, Barfi, Rasgulla, Ladoo, Jalebi, Jalebi, Rasgulla, Ladoo, Rasgulla, Jalebi, Ladoo, Rasgulla, Ladoo, Ladoo, Barfi, Rasgulla, Rasgulla, Jalebi, Rasgulla, Ladoo, Rasgulla, Jalebi, Ladoo.
Which sweet is preferred by most of the students?
The number of girl students in each class of a Co-educational middle school is depicted by the pictograph:
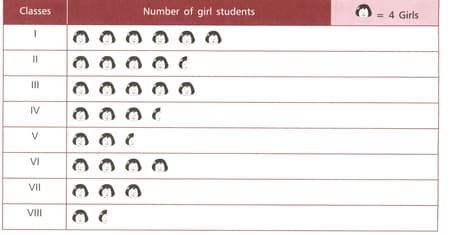
Observe this pictograph and answer the following question
Which class has the minimum number of girl students?
The number of girl students in each class of a Co-educational middle school is depicted by the pictograph:
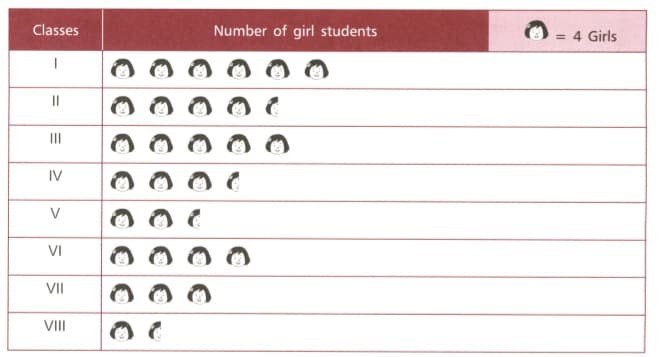
Observe this pictograph and answer the following questions:
Is the number of girls in Class less than the number of girls in Class ?
The number of girl students in each class of a Co-educational middle school is depicted by the pictograph:

Observe this pictograph and answer the following question:
How many girls are there in Class ?
Number of persons in various age groups in a town is given in the following table.
| Age group | and above |
|||||
| Number of persons |
Draw a bar graph to represent the above information and answer the following question.
(take unit length thousands)
Which two age groups have same population?
Number of persons in various age groups in a town is given in the following table.
| Age group | and above |
|||||
| Number of persons |
Draw a bar graph to represent the above information and answer the following question.
(take unit length thousands)
All persons in the age group of and above are called senior citizens. How many senior citizens are there in the town.


