
Bar Graphs
Important Questions on Bar Graphs
Two friends Sonal and Sameera draw bar graphs to represent the same information. Can the height of the corresponding bars drawn by the two be different? Give reasons.
What is the significance of height and width of a bar?
What information does the bar graph give?
Two bars of same height represent _____ frequency. (equal/unequal).
Bars can be drawn either vertically or horizontally.
In a bar graph showing various modes of transportation used by students to travel to school, the bar having minimum length represents the most likely mode of transportation.
In a bar graph, bars are drawn with equal spacing between them.
Width of the bar is of no significance. It is merely for attraction.
Bar graphs can be drawn only vertically.
To represent the population of different towns using a bar graph, is it convenient to take one unit length to represent one person.
In a bar graph, each bar (rectangle) represents only one value of the numerical data.
Number of persons in various age groups in a town is given in the following table.
| Age group | and above |
|||||
| Number of persons |
Draw a bar graph to represent the above information and answer the following question.
(take unit length thousands)
All persons in the age group of and above are called senior citizens. How many senior citizens are there in the town.
Number of persons in various age groups in a town is given in the following table.
| Age group | and above |
|||||
| Number of persons |
Draw a bar graph to represent the above information and answer the following question.
(take unit length thousands)
Which two age groups have same population?
The given bar graph represents the circulation of newspapers in different languages. Study the graph and answer the following questions.
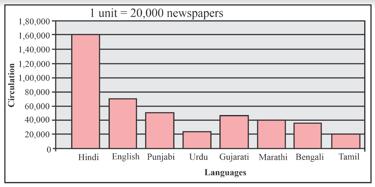
In which language is the circulation highest?
Why is reading newspaper a good habit?
The given bar graph represents the circulation of newspapers in different languages. Study the graph and answer the following questions.

In which language is the circulation least?
The given bar graph represents the circulation of newspapers in different languages. Study the graph and answer the following question.
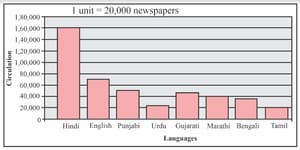
What is the total circulation of newspapers in Hindi, Marathi and Tamil?
Given alongside is a bar graph. Look at it carefully and answer the following questions:
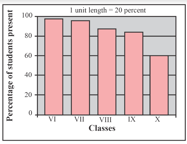
In which class are the students most irregular?
Should you be regular or irregular in your school?
Given alongside is a bar graph. Look at it carefully and answer the following questions:
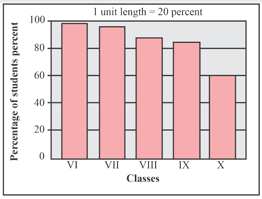
Which class has the highest percentage of students present?
Given alongside is a bar graph. Look at it carefully and answer the following questions:
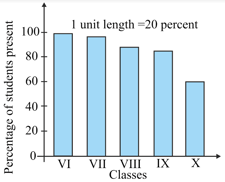
What information does the bar graph give?


