
Sajit Kumar and M. Gagan Solutions for Chapter: Data Interpretation, Exercise 1: Multiple Choice Questions
Sajit Kumar Teaching and Research Aptitude Solutions for Exercise - Sajit Kumar and M. Gagan Solutions for Chapter: Data Interpretation, Exercise 1: Multiple Choice Questions
Attempt the free practice questions on Chapter 7: Data Interpretation, Exercise 1: Multiple Choice Questions with hints and solutions to strengthen your understanding. NTA - UGC NET/SET/JRF/Lectureship Teaching and Research Aptitude Paper I solutions are prepared by Experienced Embibe Experts.
Questions from Sajit Kumar and M. Gagan Solutions for Chapter: Data Interpretation, Exercise 1: Multiple Choice Questions with Hints & Solutions
In a large random data set following a normal distribution, the ratio of the number of data points which are in the range of (meanstandard deviation) to the total number of data points is
Which one of the following methods serves to measure the correlation between two variables?
Which of the following graphs does not represent the regular (periodic) behavior of the variable f(t)?
Which of the following sources of data is not based on primary data collection?
The population of a city is plotted as a function of time (years) in graphic form below:
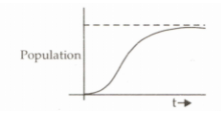
Which of the following inference can be drawn from the above plot?
Which of the following methods will you choose to prepare a choropleth map of India showing the urban density of population
Which of the following methods is best suited to show on a map the types of crops being grown in a region
A ratio represents the relation between


