
Saket Sharma Solutions for Exercise 1: Exercise 1
Saket Sharma Elementary Mathematics Solutions for Exercise - Saket Sharma Solutions for Exercise 1: Exercise 1
Attempt the free practice questions from Exercise 1: Exercise 1 with hints and solutions to strengthen your understanding. Mathematics Express solutions are prepared by Experienced Embibe Experts.
Questions from Saket Sharma Solutions for Exercise 1: Exercise 1 with Hints & Solutions
The annual income of a person decreases by if the annual rate of interest decreases from to . What is his original annual income?
Out of a total children playing badminton or table tennis or both, total number of girls in the group is of the total number of boys in the group. The number of boys playing only badminton is of the number of boys and the total number of boys playing badminton is of the total number of boys. The number of children playing only table tennis is of the total number of children and a total of children play badminton and table tennis both. What is the number of girls playing only badminton is:
A person bought two articles X and Y from a department store. The sum of prices before sales tax was ₹ there was no sales tax on the article X and sales tax on the article Y. The total amount the person paid, including the sales tax was ₹ .What was the price of the article Y before sales tax ?
are three numbers such that is of and is of . If is of then what is the value of ?
If an article is sold at gain of instead of a loss of , the seller gets more. What is the cost price of the article?
The price of an article X increases by every year and price of article Y increases by every year. In the year , the price of article X was and price of article Y was . In which year the difference in their prices exceeded for the first time?
The number of items in a booklet is . In the first year there is an increase of in this number and in the subsequent year there is a decrease of . At the end of the two years, what will be the number of items in the booklet ?
The following Bar chart gives the production of cars by three different companies X, Y, Z in different years:
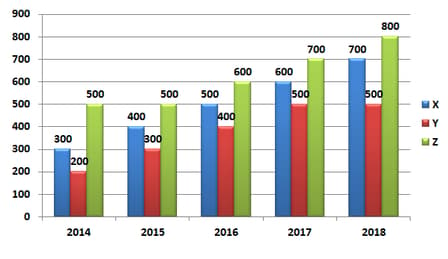
In which year was the percentage increase in production of cars minimum as compared to its previous year?


